India’s Industrial Sector: The Rise of the Contract Worker
In the years 2019 and 2020, the Parliament passed four labour code bills. These were The Wage Code (WC), 2019, the Industrial Relations Code (IRC), 2020, the Social Security Code (SSC), 2020, and the Occupational Safety, Health and Working Conditions Code (OSHWC), 2020.
According to news reports, these four labour codes will be implemented by October 2021, as rules are yet to be notified. The idea behind these labour codes is to simplify archaic labour laws in the country and thereby modernize them. These labour codes will replace a panoply of 29 labour laws which have been criticized for restricting the growth of employment and formalization of employment. Some have argued that while existing labour laws are very flexible, they are so numerous, and complex that they promote litigation rather than resolution of problems. [1]
Industry bodies welcomed the passing of these four labour codes on account of operational freedom that they would provide even as they are likely to raise their costs.
What does the growth of factories, contract workers and directly employed workers in the recent past tell us? To answer this question, we take a closer look at Annual Survey of Industries reports.
Annual Survey of Industries
Annual Survey of Industries (ASI) is conducted by the National Sample Survey Organisation (NSSO) every year and it is the main source of industrial statistics in India. The two volume ASI report provides detailed results of the manufacturing sector in the country. Along with basic information about the number of manufacturing establishments or “factories’’ and workers, it also provides us data related to inputs, outputs, material consumption, capital deployed in the industrial sector in the country etc.
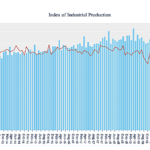
In this data narrative, we look at data between 2001-02 and 2017-18. The ASI report for 2017-18 is the latest report released by the NSSO. Figure 1 tells us about the growth in the number of factories and workers employed between 2001-02 and 2017-18.
Figure 1
The year in the figure refers to the Financial Year. E.g., 2002 refers to Financial Year 2001-02 (April 2001 to March 2002)
One of the criticisms of India’s labour laws is the restrictions they placed on the growth of employment and the formalization of employment. Under these laws, establishments that employed 100 or more workers needed government permission for closure, layoffs, or retrenchment. The argument was that this prevented factories from scaling up by employing more workers as demand went up because it would be difficult to reduce the size of the workforce when demand goes down. The IRC 2020 raises this limit to 300 workers. What does ASI data tell us about factory size in India? Figure 2 tells us about the distribution of factories in operation in India by employment range in 2017-18.
Figure 2
On closer look at this data, we find that 81 percent of all factories in operation in 2017-18 employed less than 100 people. These 81 percent factories employ only 22.25 percent of all factory workers in the country. Figure 3 tells us about the distribution of workers across factories by employment range in 2017-18. We find that the highest number of workers (19.2 percent) are employed in factories that employ between 200 to 499 people. But these factories make up for only 6.1 percent of all factories in operation in the country.
Figure 3
The Contractual Worker Story
To exploit its demographic dividend, India must create millions of “good”— safe, productive, well-paying—jobs. [2]
Economic Survey 2015-16 underlines the importance of formal jobs and the barriers placed in creation of more formal jobs.
It notes, “The slow pace of labour reform has encouraged firms to resort to other strategies to negotiate “regulatory cholesterol”. One popular strategy is to hire contract workers, which has two key benefits: first, the firm essentially subcontracts the work of following regulations and “managing” inspectors to the contract labour firm. Second, because contract workers are the employees of the contractor and are not considered workmen in the firm, the firm stays small enough to be exempt from some labour law.”
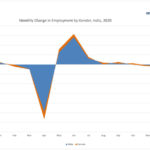
The Survey also notes that the use of contract workers grew faster in states that had relatively more rigid labour laws. Figure 4 notes the number of direct and contract workers factory between 2001-02 and 2017-18.
In 2001-02, the number of directly employed workers per factory in the country was 36.3 while the number of contract workers was 10.1 which changed to 32.7 direct workers and 18.7 contract workers per factory in 2017-18. When we plot trendlines for direct and contract workers, we see that in this period the number of direct workers per factory has been coming down while the number of contract workers per factory has been going up.
Figure 4
The year in the figure refers to the Financial Year. E.g., 2002 refers to Financial Year 2001-02 (April 2001 to March 2002)
Figure 5 looks at the number of total workers, and contract workers employed in factories between 2001-02 and 2017-18. We find that 5.96 million workers were employed in all factories in India in 2001-02, which increased by 105 percent to 12.22 million in 2017-18. At the same time, the number of contract workers increased by 243 percent from 1.3 million in 2001-02 to 4.45 million in 2017-18. As a percentage of total workers, contract workers increased from 21.8 percent in 2001-02 to 36.4 percent in 2017-18.
Figure 5
The year in the figure refers to the Financial Year. E.g., 2002 refers to Financial Year 2001-02 (April 2001 to March 2002)
Figure 5 shows the increasing propensity of firms to hire contract workers in a growing economy. We see this more clearly in Figure 6 which depicts the Compounded Annual Growth Rates for direct and contract workers between 2002-03 and 2017-18. We find the CAGR for contract workers to be consistently higher than direct workers. Even in 2013, when we see a dip in the number of total workers, the decline is a little more in case of contract workers.
Figure 6
The year in the figure refers to the Financial Year. E.g., 2003 refers to Financial Year 2002-03 (April 2002 to March 2003)
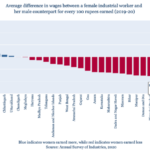
It is ironical that while rigid labour laws are supposed to protect worker rights, they have led to a jump in use of contract labour which is not an ideal situation given the lack of social security in the form of provident fund, bonuses, health insurance, life insurance and higher wages that a formally hired worker benefits from. Besides the obvious benefit of higher wages in formal jobs, contract workers also suffer from a lack of employment history which deprives them of formal credit opportunities.
Figure 7 tracks real average daily earnings of a directly employed and contract worker between 2002-03 and 2016-17. The nominal average daily earnings have been adjusted for inflation with 2011-12 as base year to arrive at real average daily earnings. In 2002-03, a directly employed worker earned Rs 162 per day, while a contract worker made Rs 148 or only 91 percent of a directly employed worker’s earnings. In 2016-17 however, a contract worker’s average daily earnings (Rs 275) were only 76 percent of a directly employed worker’s earnings (Rs 362).
Figure 7
The year in the figure refers to the Financial Year. E.g., 2003 refers to Financial Year 2002-03 (April 2002 to March 2003)
ASI data between 2001-02 and 2017-18 tells us about growth in India’s industrial sector with the number of factories rising 85 percent from 128,549 in 2001-02 to 237,684 in 2017-18. At the same time the total number of workers increased by 105 percent (with the highest growth seen in the numbers of contract workers which swelled by 243 percent).
This trend is also seen in the rise in Fixed Capital deployed in these factories. Figure 8 depicts the change in Fixed Capital deployed in these factories (adjusted for inflation, Base Year 2011-12). We note a 316 percent rise in Fixed Capital between 2001-02 and 2017-18.
Figure 8
The year in the figure refers to the Financial Year. E.g., 2002 refers to Financial Year 2001-02 (April 2001 to March 2002)
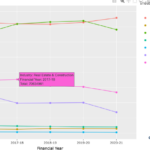
In Figure 9, we have calculated the CAGR for Fixed Capital Per Directly Employed and Contract Worker. While we see growth in Fixed Capital deployed in factories, we find that the CAGR for Fixed Capital Per Contract Worker is consistently lower than that for direct workers. Between 2001-02 and 2005-6, it was negative. This implies the much faster growth in the number of contract workers as compared to directly employed workers.
Figure 9
The year in the figure refers to the Financial Year. E.g., 2003 refers to Financial Year 2002-03 (April 2002 to March 2003)
ASI data from 2001-02 to 2017-18 shows the growth in India’s manufacturing sector and in the number of workers employed. It also tells us about the significant rise in share of contract workers on India’s factory floors in the latest survey. While India’s rigid labour laws are said to be the reason behind this rise in contract workers, others disagree. A study [3] of 1,300 firms also found that “the absence of a union appears to be slightly more likely to facilitate a growth in employment than its presence as a larger proportion of unionized than non-unionized firms reduced their employment”.
IRC 2020 has brought in the option for companies to hire contract workers directly through fixed-term contracts. Fixed-term contract workers receive all the dues that directly employed workers are entitled to but are not entitled to severance benefits. Thus, it is an improvement over contractual employment and provides companies flexibility in hiring workers. However, the IRC 2020 also allows companies to convert permanent positions to fixed-term positions. The fixed-term contract mechanism has also come in for criticism for not providing a cap on the number of times such a contract can be renewed before the position is converted into a permanent position. Such caps exist in other countries like China, Vietnam, and Sri Lanka.
While the period between 2001 and 2018 saw the rise of the contract worker in Indian industries, these changes in labour codes might lead to a jump in fixed-term contract workers in the future.
[1] Flexibility, Employment and Labour Market Reforms in India, Sharma, EPW, May 2006
[2] Structural Changes in India’s Labour Markets, Chapter 10, Economic Survey 2015-16
[3] Liberalisation and Labour: Labour Flexibility in Indian Manufacturing, Institute for Human Development, Deshpande, Sharma et al
If you wish to republish this article or use an extract or chart, please read CEDA’s republishing guidelines.