

Data Portal
The CEDA data portal aims to be a comprehensive repository of various socio-economic indicators gleaned from official databases, surveys and administrative data pertaining to the Indian economy.
Data Explorers and Tools

Socio-Economic Data Tool
The CEDA Socio-Economic Data tool is a comprehensive repository of socio-economic data from official sources on Indian economy. It allows users to analyse and correlate variables across geographies, time, datasets.

Agri Market Data Tool
The CEDA Agri-Market data portal offers data on prices and quantities of over 300 agricultural commodities from over 2700 mandis across India, spanning from the year 2000 to the present and updated monthly.

Daily Food Prices Data Tool
The CEDA Daily Food Prices data tool offers daily updates on retail and wholesale prices of 22 essential commodities from over 100 centers across India since 2009, available at city and zonal levels.
Currently maintained by the Centre for Data Science and Analytics, Ashoka University.

EcoMeter
CEDA EcoMeter showcases high-frequency macroeconomic and alternative indicators across different sectors and industries in an easy-to-understand format.
Currently maintained by the Centre for Data Science and Analytics, Ashoka University.
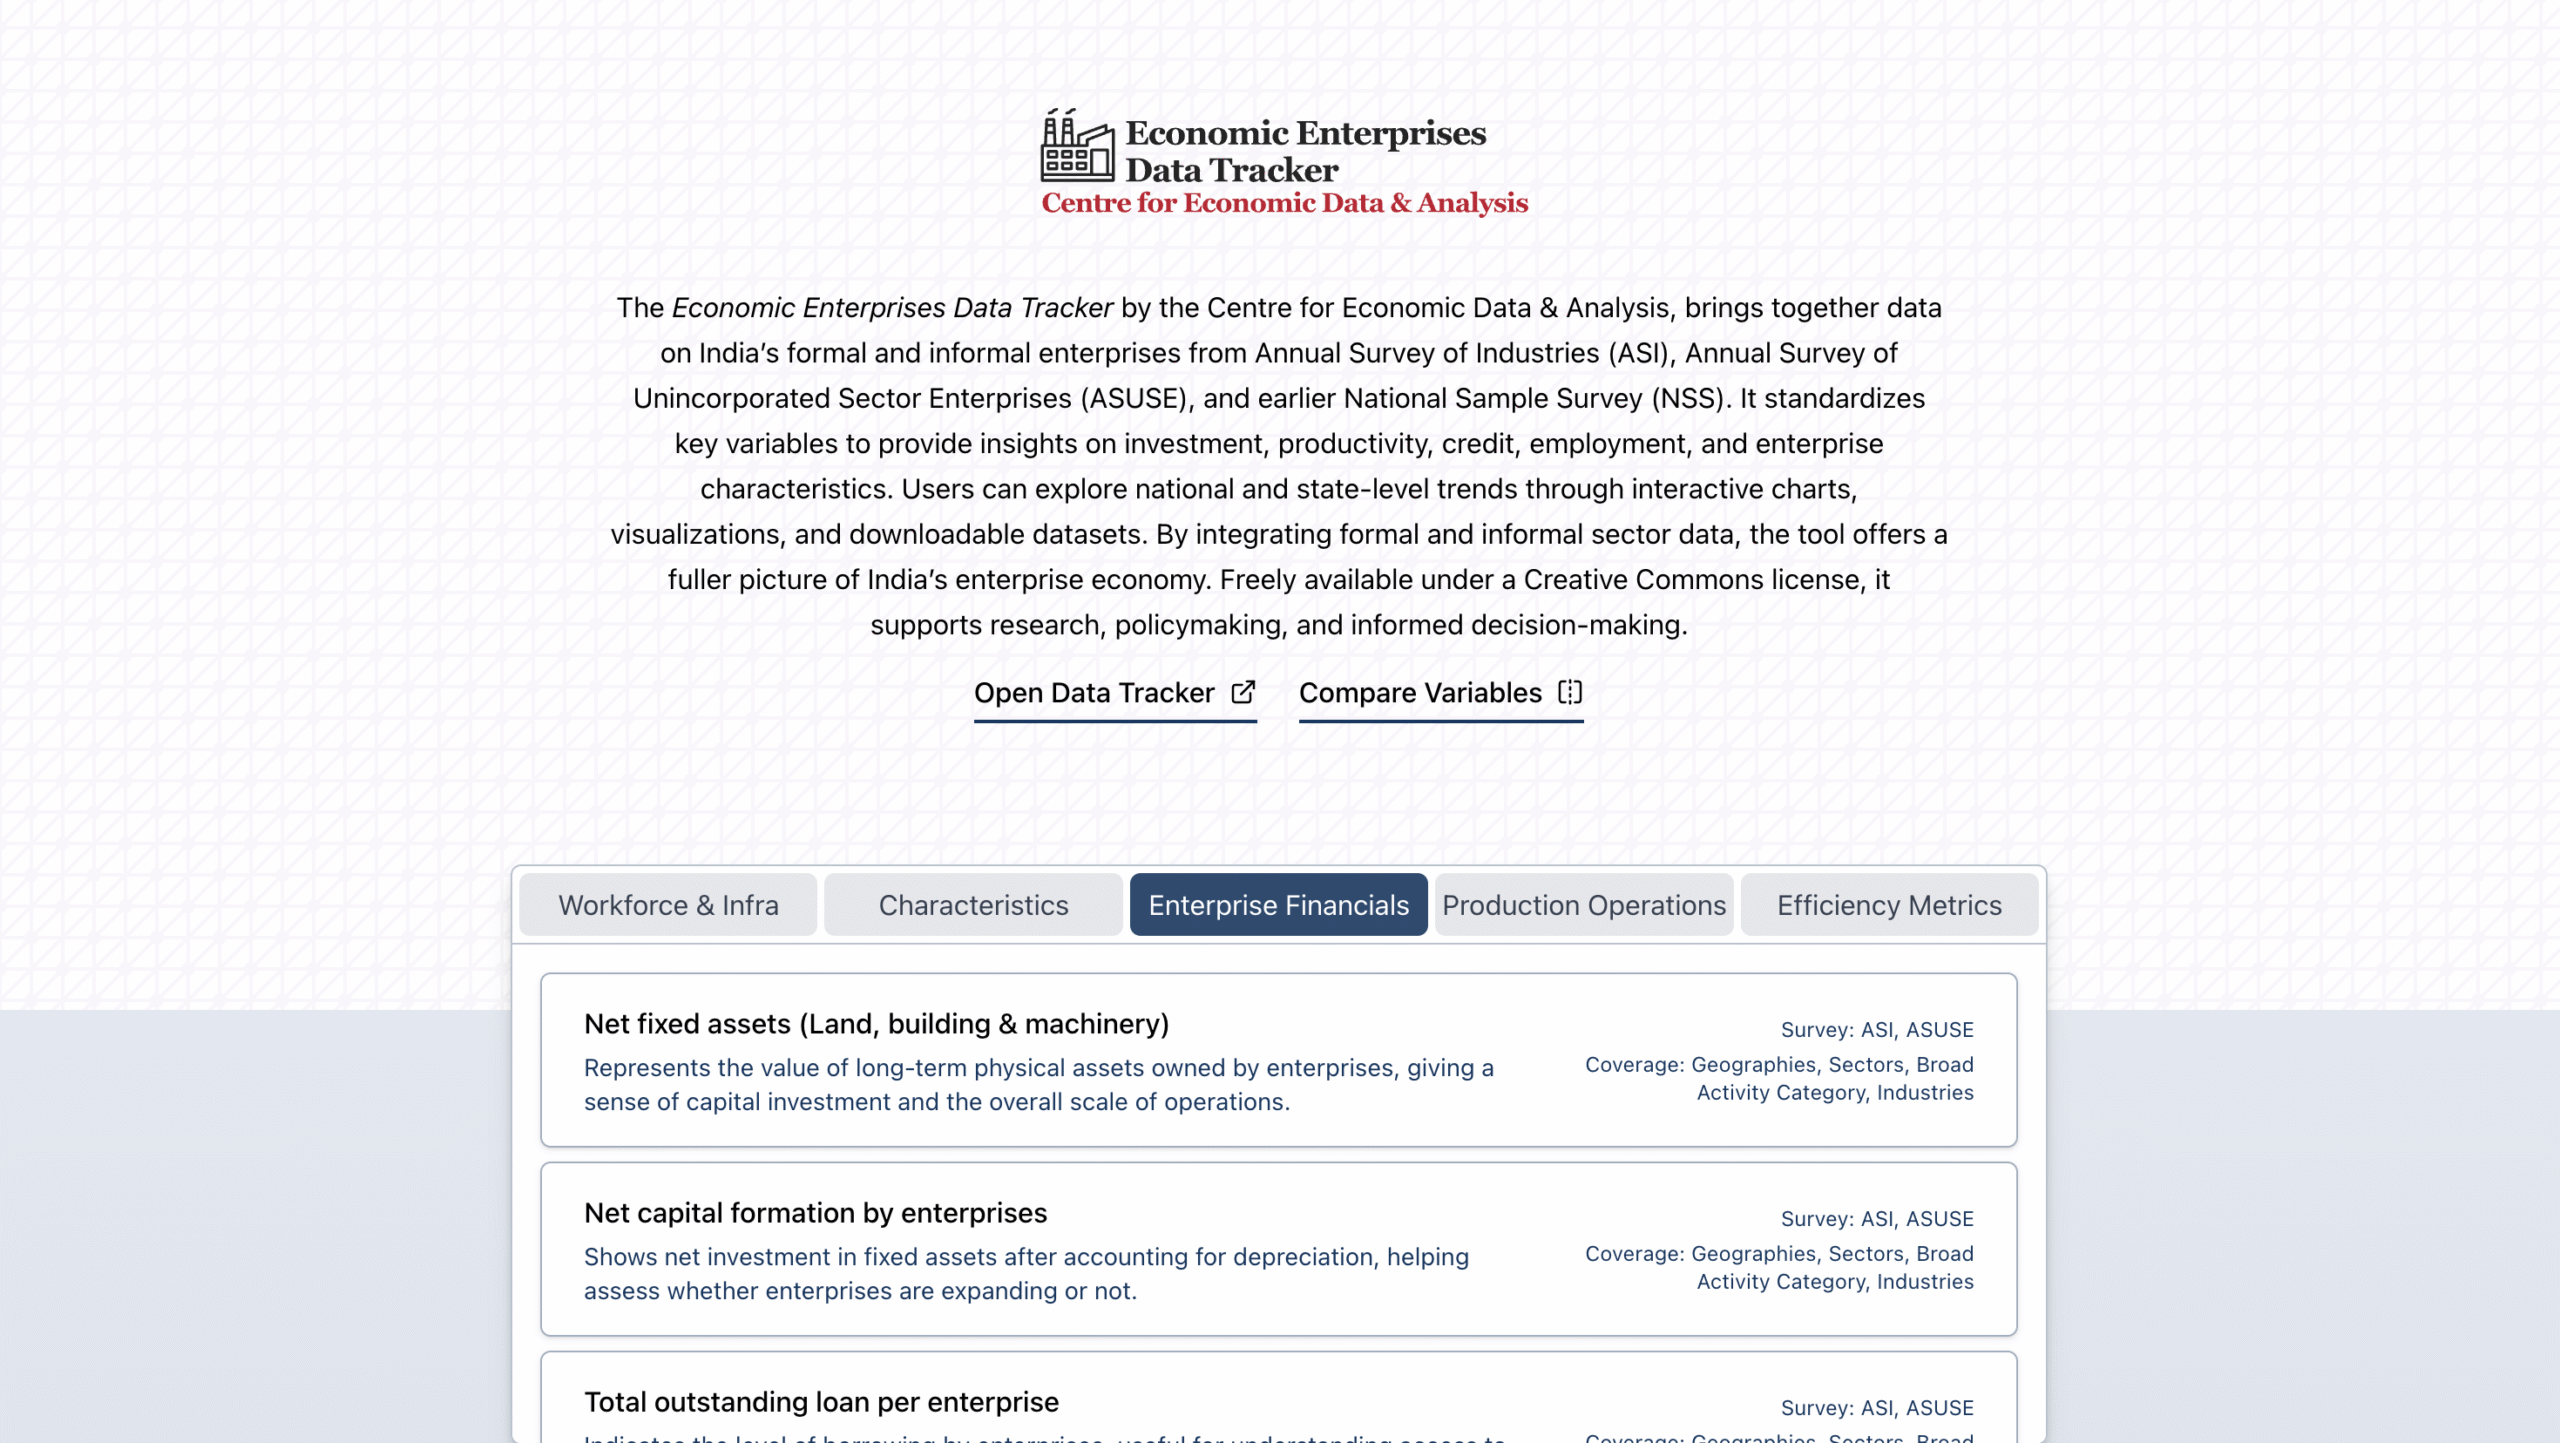
CEDA Economic Enterprise Data Tracker
The Economic Enterprises Data Tracker by the Centre for Economic Data & Analysis, brings together data on India’s formal and informal enterprises from Annual Survey of Industries (ASI), Annual Survey of Unincorporated Sector Enterprises (ASUSE), and earlier National Sample Survey (NSS).
Impact in Numbers
23
DATASETS
480
VARIABLES
3
GEOGRAPHICAL LEVELS
285M
DATA POINTS
Features of the Portal
Generate Heat Maps
Provides extensive coverage of variables across datasets like NSS, Census, NFHS, and SRS. Filter data by time, geography, gender. Offers high-resolution heat maps, line and bar charts.

Easy to Compare Variables
Allows comparison of variables across datasets and provides analysis over time and regions. It generates easy-to-interpret scatterplots to study correlations between any two variables.

Navigate across Categories
Select desired variables from broad categories like health, education, and demographics. Navigate through a hierarchy of categories and sub-categories to find specific variables.

Data Notes and Sources
Below are some of the data tools that are offered by CEDA
Tool: Socio-Economic Data Portal
Coverage: Socio-economic data from large scale sample surveys, census surveys, and other administrative sources, covering the Indian economy at national, state, and district levels.
Series/ Variables: 380
Notes: access here
Tool: Agri Market Data Portal
Coverage: Data from the Ministry of Agriculture and Farmers Welfare on daily commodity prices and quantity arrivals from government-regulated agricultural markets (mandis) across India, available since 2001.
Series/ Variables: Monthly aggregated data on price and quantity trends at all India, state, and district levels, including spatial visualisations (heat maps) for each commodity.
Notes: The original data can be accessed here. The cleaned data and methodology are detailed in the CEDA Agri Market Data README.
Tool: Daily Food Prices Data Portal
Coverage: Retail and wholesale prices of 22 essential commodities across India from 2009 to the present, updated daily. The data spans national, state, and centre levels, with changes in reporting starting September 2023.
Series/ Variables: Daily retail and wholesale price data at the state and national levels from 2014 onwards, and centre-level data from 2009 to September 2023.
Notes: The original price reports and methodology are available here. The raw data and visualisations, along with detailed methodology, are provided in the CEDA Daily Food Prices README.
Tool: EcoMeter
Coverage: High-frequency macroeconomic and other indicators across various sectors and industries.
Series/ Variables: Unemployment Rate, Fuel Consumption (including ATF, Bitumen, HSD, LPG, etc.),Foreign Exchange Reserves (in INR and USD), Indian Imports & Exports (in INR and USD),Flights Data (air freight carried, total departures, total passengers),Money and Banking Non-Food Credit, Deposits in SCBs, GST Statistics (including E-way Bill values, registrations of taxpayers, etc.)
Notes: Data is presented in an easy-to-understand format, facilitating analysis across multiple economic indicators and sectors.
Data Portal API
Use our Data Portal API to access raw, frequently updated data from our Data portal in a programmatic manner. Build CEDA data, straight from the source, into your applications and dashboards for added insights and deeper analyses.
Now available for CEDA Agri Market Data, with other Data Portal datasets coming soon.
