Key highlights
- Nearly 1 in 4 enterprises in the informal sector were owned by women in 2024.
- By 2022, women accounted for the majority of ownership in informal sector manufacturing enterprises, with their share crossing the 50 percent mark.
- In 2024, women owned only about 1 in 7 informal enterprises engaged in trade and services.
- Northeastern states record the highest female ownership of informal enterprises engaged in trade, with only Tripura and Assam lagging below the national average
When we think of women entrepreneurs, we tend to picture the visible few: founders in formal offices, building startups and scaling businesses. But most women who own enterprises in India are not in boardrooms. They are running tailoring units, small manufacturing setups, retail shops, and local services- often from homes or neighbourhood spaces, largely outside the formal spotlight. While less prominent in mainstream narratives, this segment plays a significant role in shaping women’s ownership in India. This is the landscape captured by data on unincorporated non-agricultural enterprises, drawn from the National Sample Survey (NSS) 67th round (2010-11), 73rd round (2015-16) and the Annual Survey of Unincorporated Sector Enterprises (ASUSE). Visualised through CEDA’s Economic Enterprise Tracker, the analysis foregrounds the broader base of women-owned enterprises.
The article traces how women’s ownership in the informal sector has evolved over time at the national level, before examining patterns across manufacturing, trade, and services. Within each of these, it also looks at variation across states to understand how ownership is distributed geographically. Together, this provides a more grounded view of women’s enterprise ownership in India, highlighting both its expansion and the uneven ways in which it is spread across sectors and regions.
A 1.5-fold increase yet women remain a minority of enterprise owners
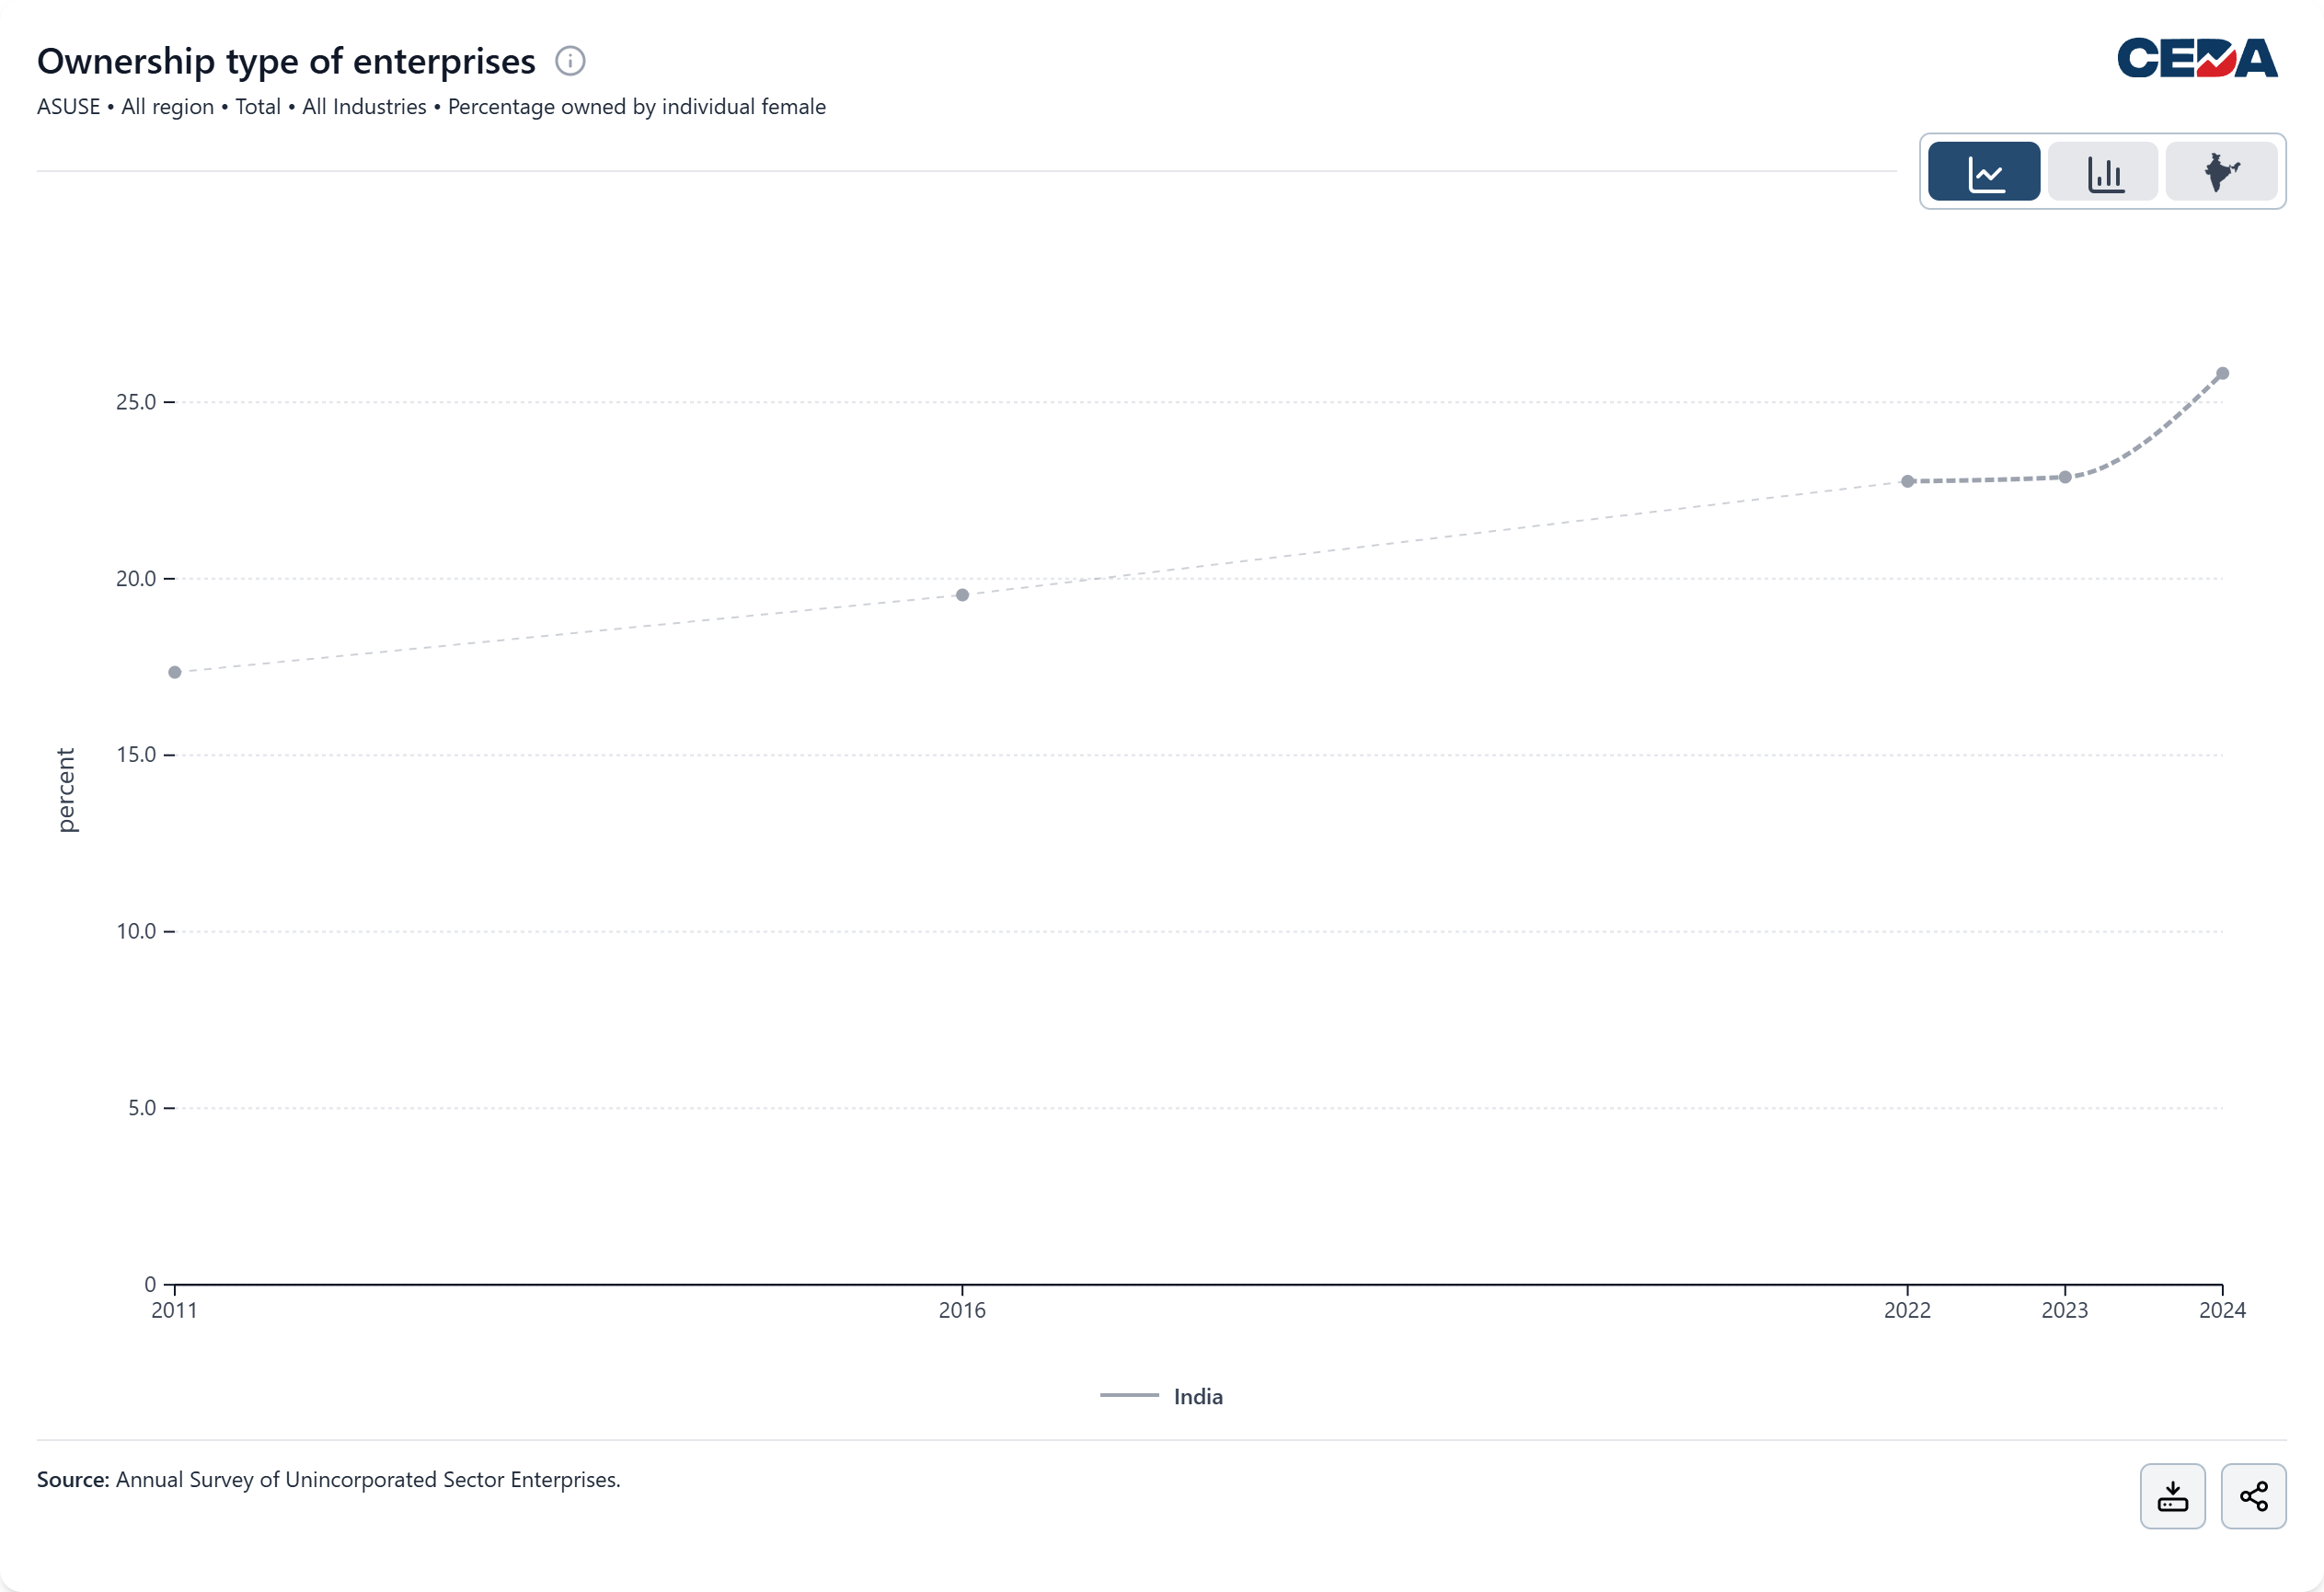
Figure 1 shows female ownership, across all industries in the informal sector, has increased steadily but remains limited in scale, rising from 17.4 percent in 2011 (fewer than 2 in 10 enterprises) to 25.8 percent in 2024 (just over 1 in 4), an increase of nearly 1.5 times over the period. Growth has been gradual, with a 2.2 percentage point rise between 2011-2016 and a 3.2 percentage point increase between 2016-2022, followed by more modest year-on-year gains of 0.12 percentage points (2022-23) and 2.94 percentage points (2023-24).
Manufacturing stands out as women’s strongest foothold in informal enterprise ownership

Figure 2 shows a steady rise in female ownership in manufacturing over the past decade, from 38.9 percent in 2011 (fewer than 4 in 10 enterprises) to 45 percent in 2016. The pace of growth then accelerates, with ownership increasing by a further 8.4 percentage points to 53.5 percent in 2022, marking a shift as women begin to constitute the majority of enterprise owners in the sector. The trend continues upward but at a slower pace in recent years, with year-on-year gains moderating to 0.9 percentage points between 2022-23 and 3.9 percentage points between 2023-24, bringing the share to 58.4 percent, nearly 6 in 10 manufacturing enterprises.
High female ownership in informal sector manufacturing masks stark regional imbalances
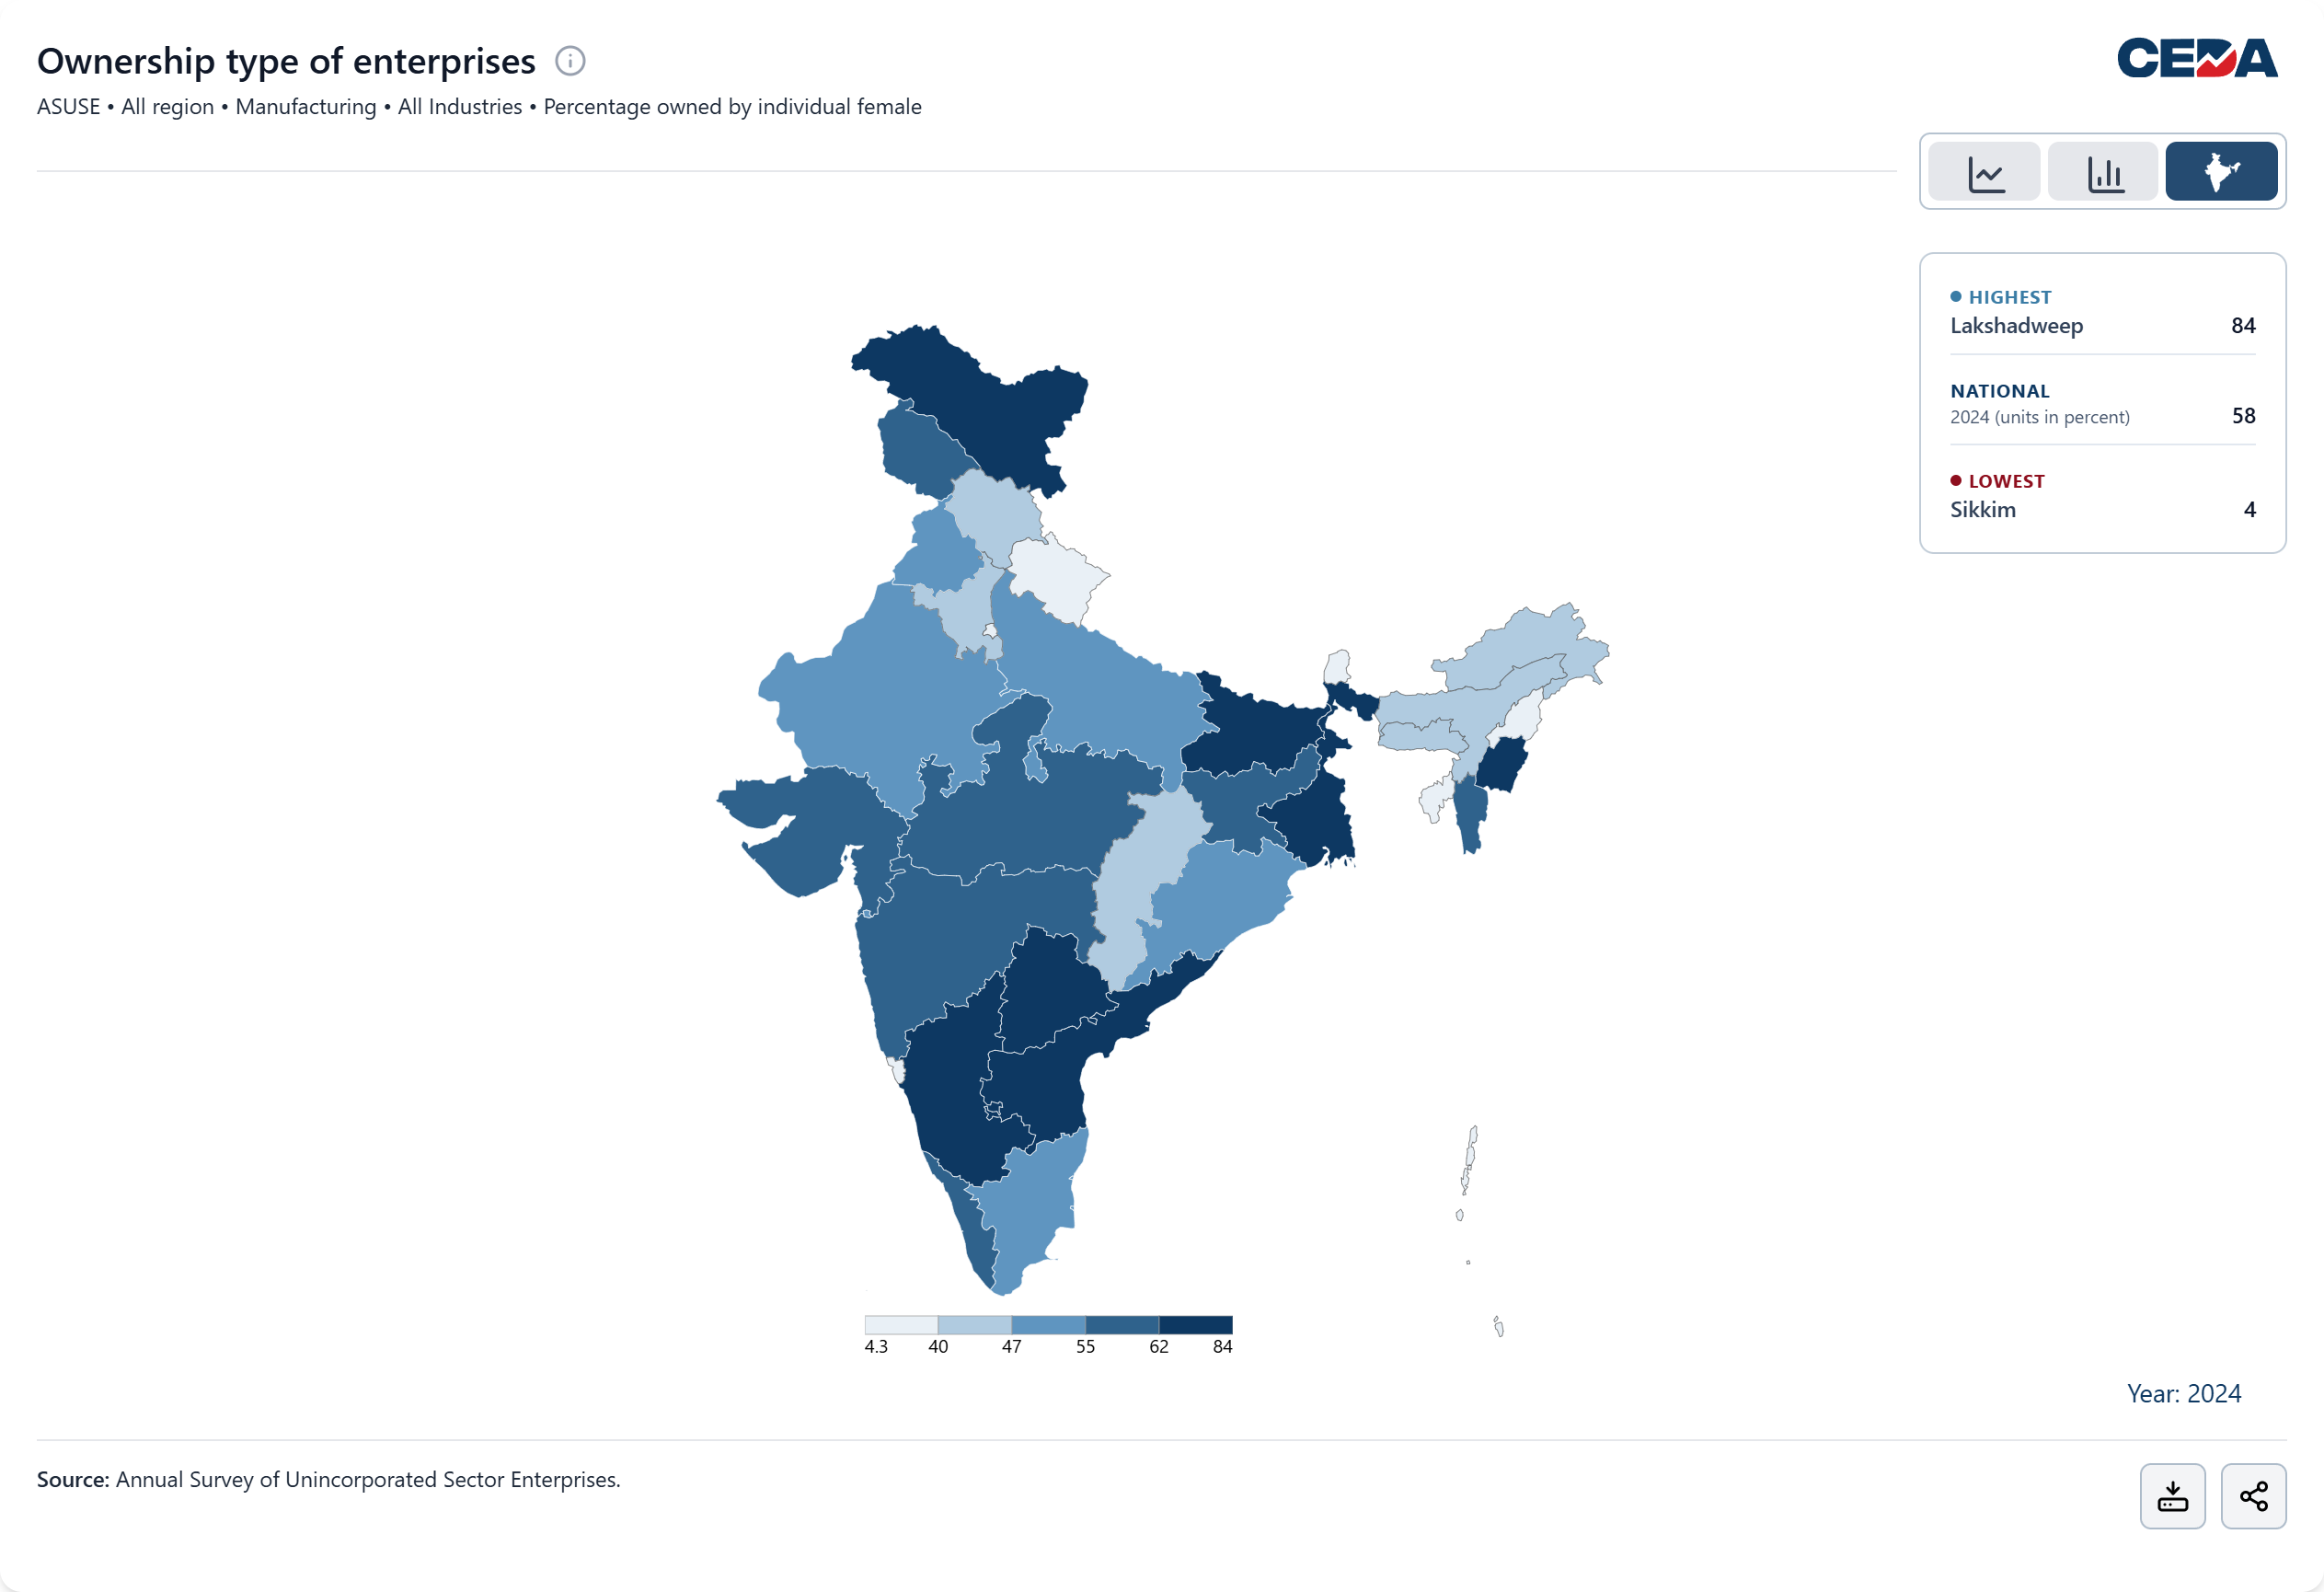
Building on the upward national trend in informal manufacturing enterprises owned by women, regional variation in 2024 is far more uneven. Figure 3 ranges from over 8 in 10 enterprises (84 percent) in Lakshadweep to just 4 percent in Sikkim, with the highest-performing state having nearly 20 times the share of the lowest. States such as Telangana, Karnataka, West Bengal, and Bihar report female ownership levels above 60 percent, while others, including Delhi, Uttarakhand, and Nagaland, remain well below the national average (58.4 percent).
Women’s ownership share in informal sector trade has grown but remains under one in seven enterprises

Trade enterprises in the informal sector continue to be overwhelmingly male-owned, with women accounting for a relatively small share of ownership. Nonetheless, Figure 3 shows that female ownership has increased gradually, rising from 8.9 percent in 2011 (fewer than 1 in 10 enterprises) to 13.7 percent in 2024 (around 1 in 7), an increase of roughly 1.5 times over the period. After a slight decline of 0.24 percentage points between 2011-2016, ownership began to recover, with a 2.81 percentage point increase between 2016-2022. Growth has continued in recent years, with year-on-year gains of 0.83 percentage points (2022-23) and 1.36 percentage points (2023-24).
Northeastern states lead in women owned trade enterprises in the informal sector
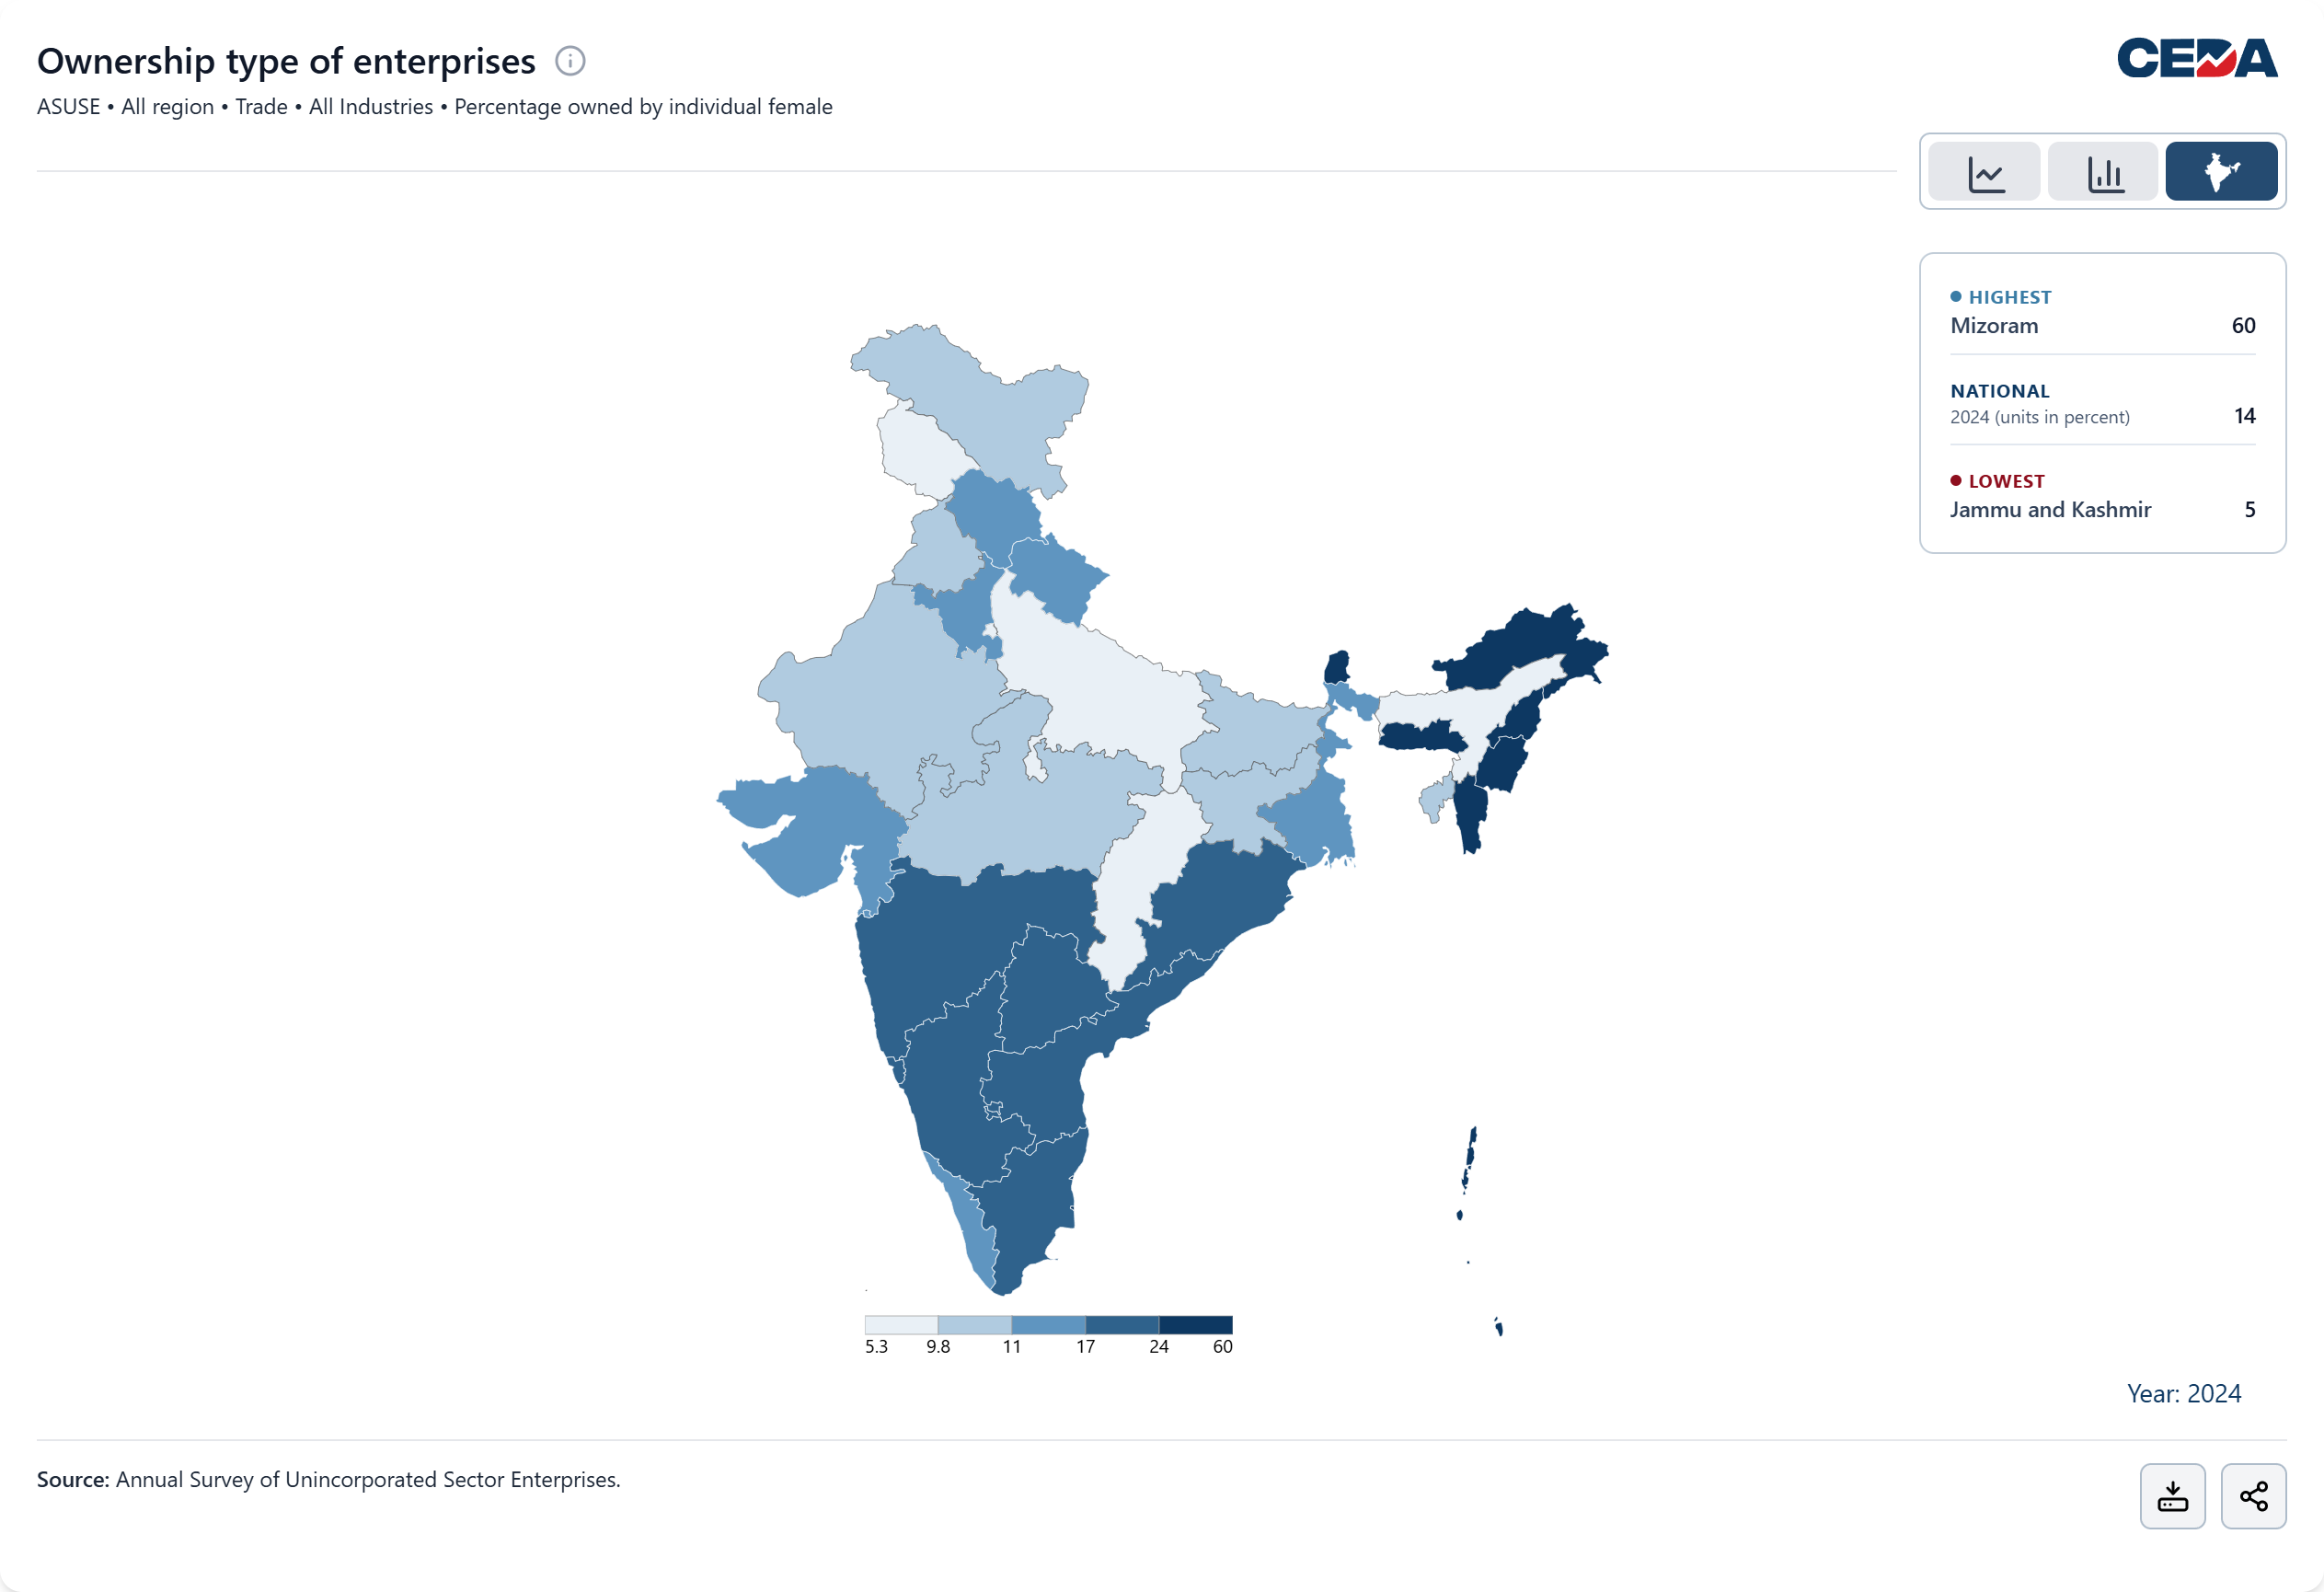
Female ownership of informal enterprises engaged in trade shows sharp interstate disparities, ranging from nearly 6 in 10 enterprises in Mizoram (59.6 percent) to just around 5 percent in Jammu & Kashmir, an 11-fold gap in 2024. Figure 5 shows northeastern states such as Mizoram, Meghalaya, Manipur, Nagaland, and Arunachal Pradesh report female ownership levels well above the national average of 14 percent, while Tripura, at around 10 percent, remains among the lower-performing states in the region, with Assam lagging further behind at roughly 8 percent. Most large states including Uttar Pradesh, Madhya Pradesh, Rajasthan, and Bihar remain below the national average, with female ownership levels at around 1 in 10 enterprises.
Since 2011 women’s ownership of enterprises engaged in the informal sector services has nearly doubled to one in seven enterprises
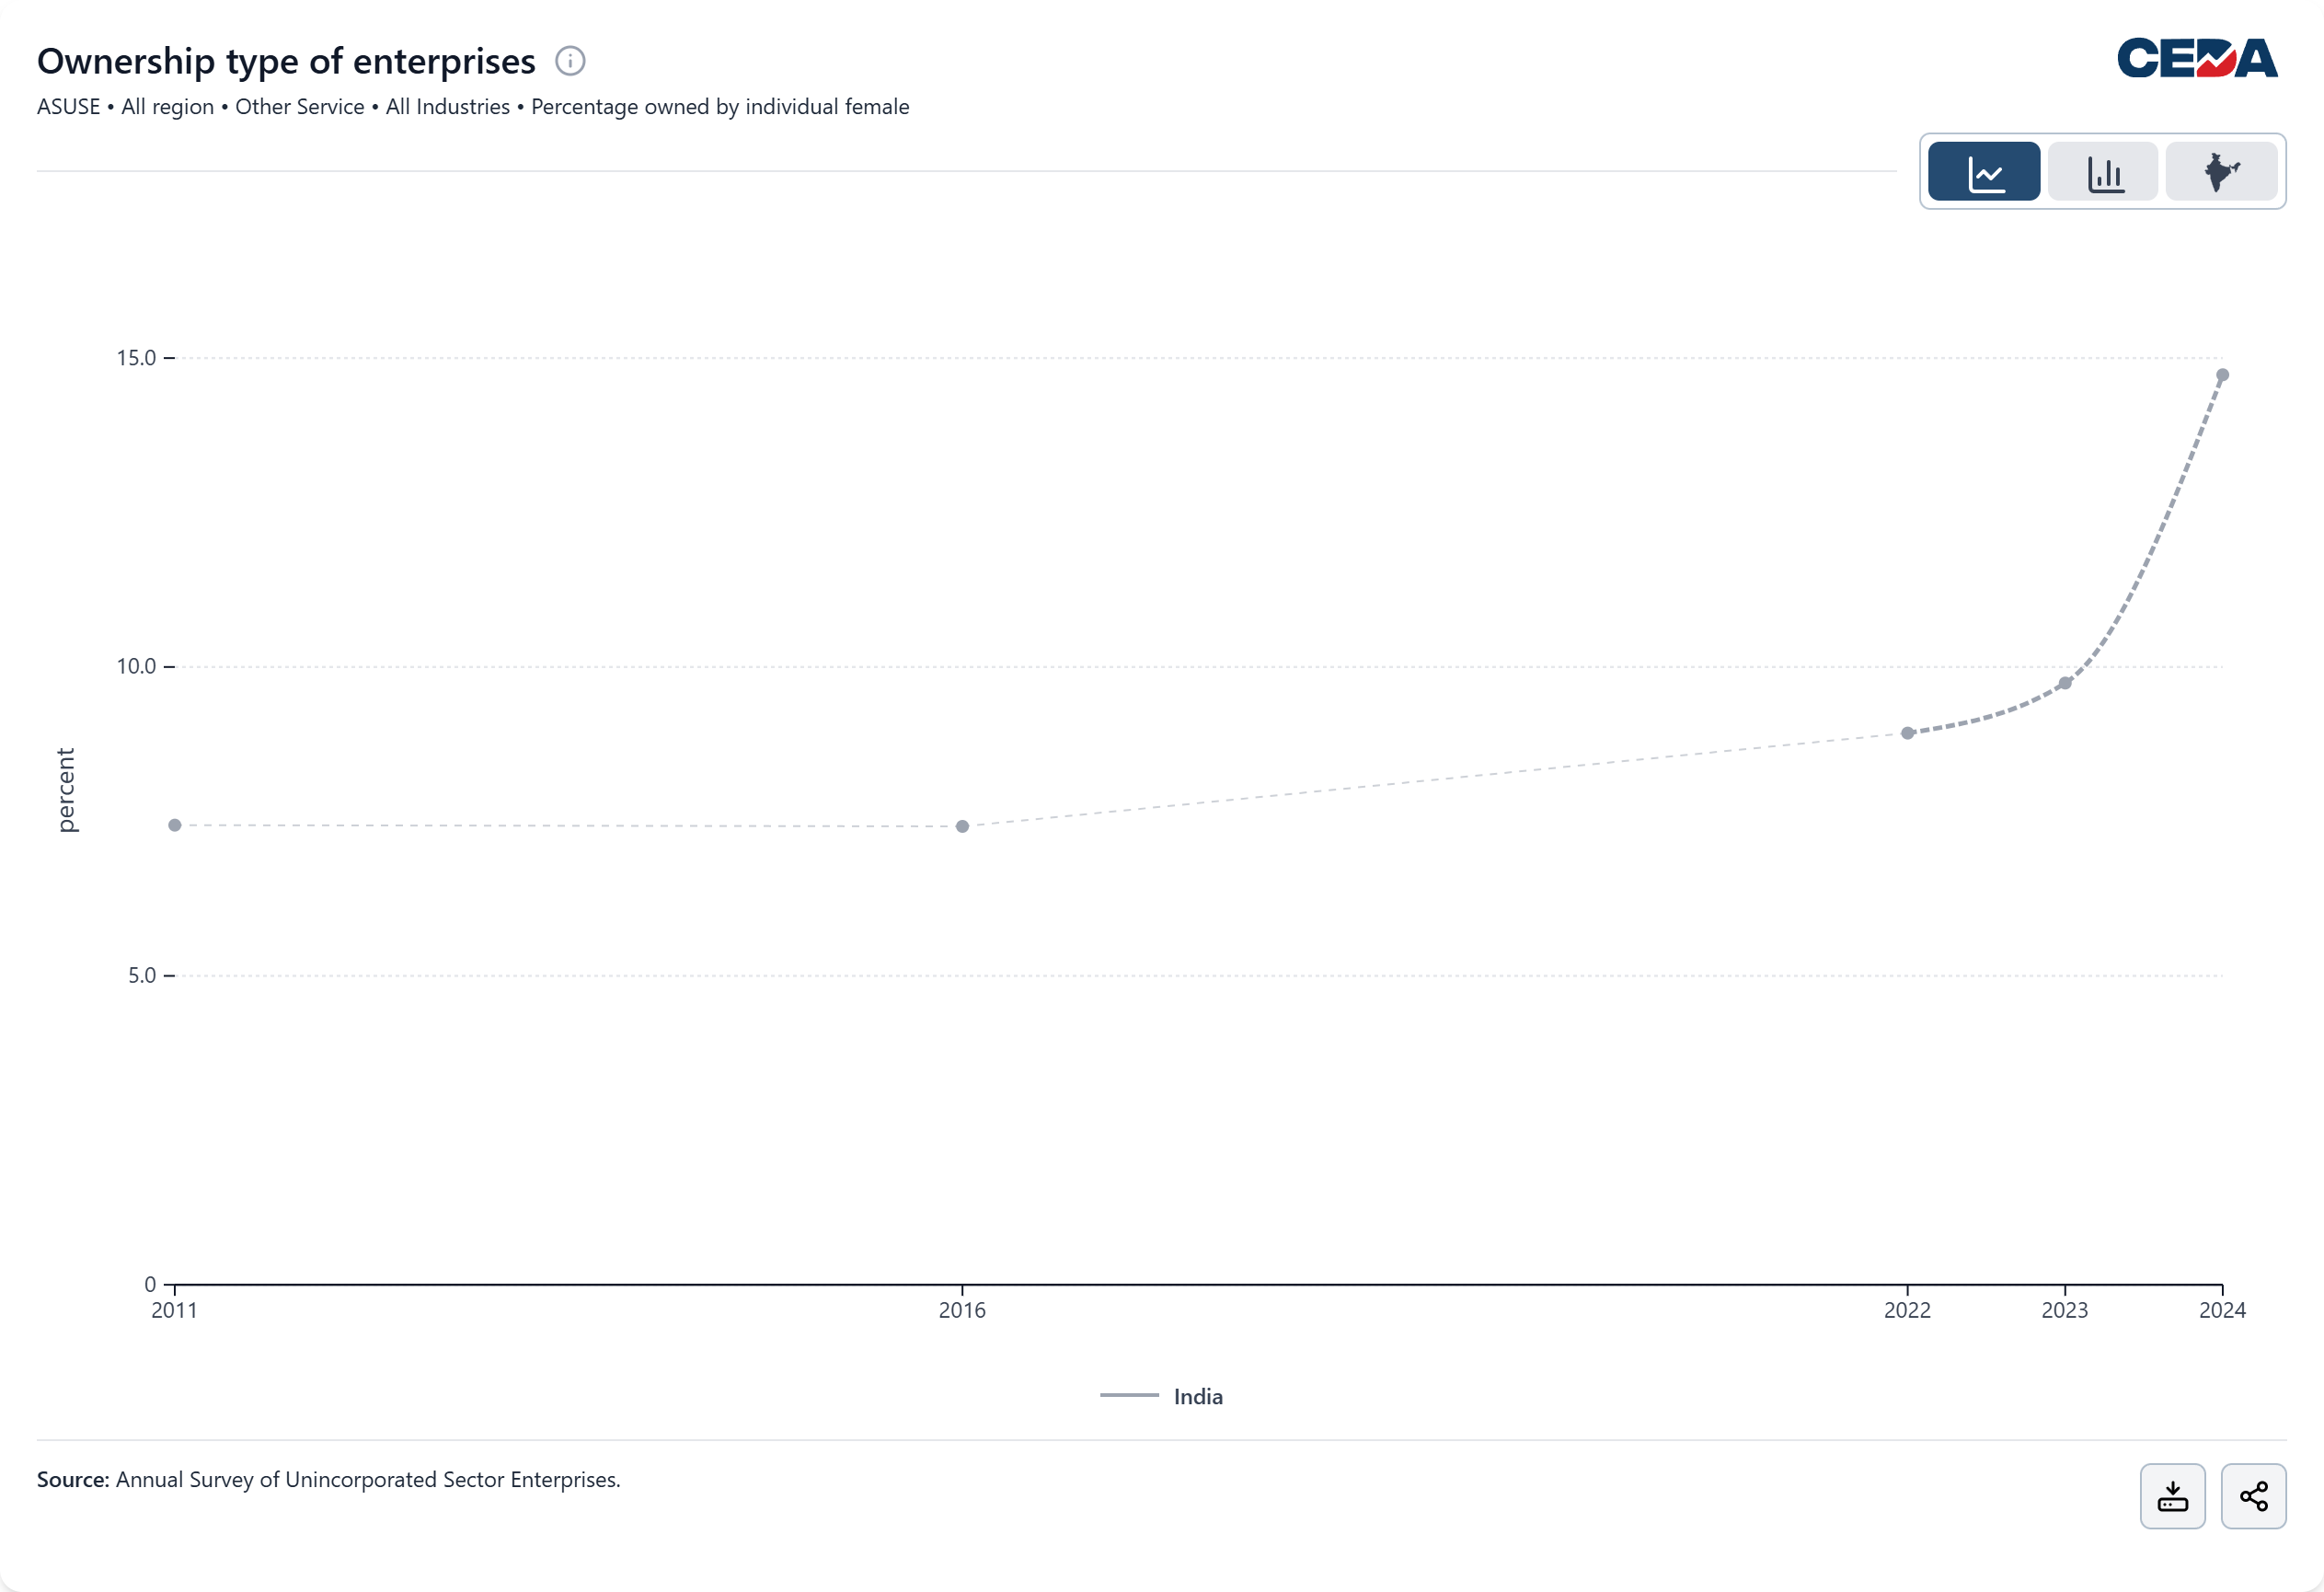
Female ownership of informal enterprises in the service sector remains low, mirroring trends in trade. Figure 6 records an increase from 7.4 percent in 2011 (around 1 in 13 enterprises) to 14.7 percent in 2024 (nearly 1 in 7), nearly doubling over the period. Growth was largely stagnant between 2011 and 2016, followed by a gradual rise of 1.51 percentage points between 2016-2022. The pace of increase has strengthened more recently, with gains of 0.81 percentage points (2022-23) and a 5 percentage point rise (2023-24). By 2024, female ownership share in services has marginally surpassed trade (14 percent), as shown in Figure 4.
In 2024, female ownership in informal sector services is limited and varies nearly tenfold across states
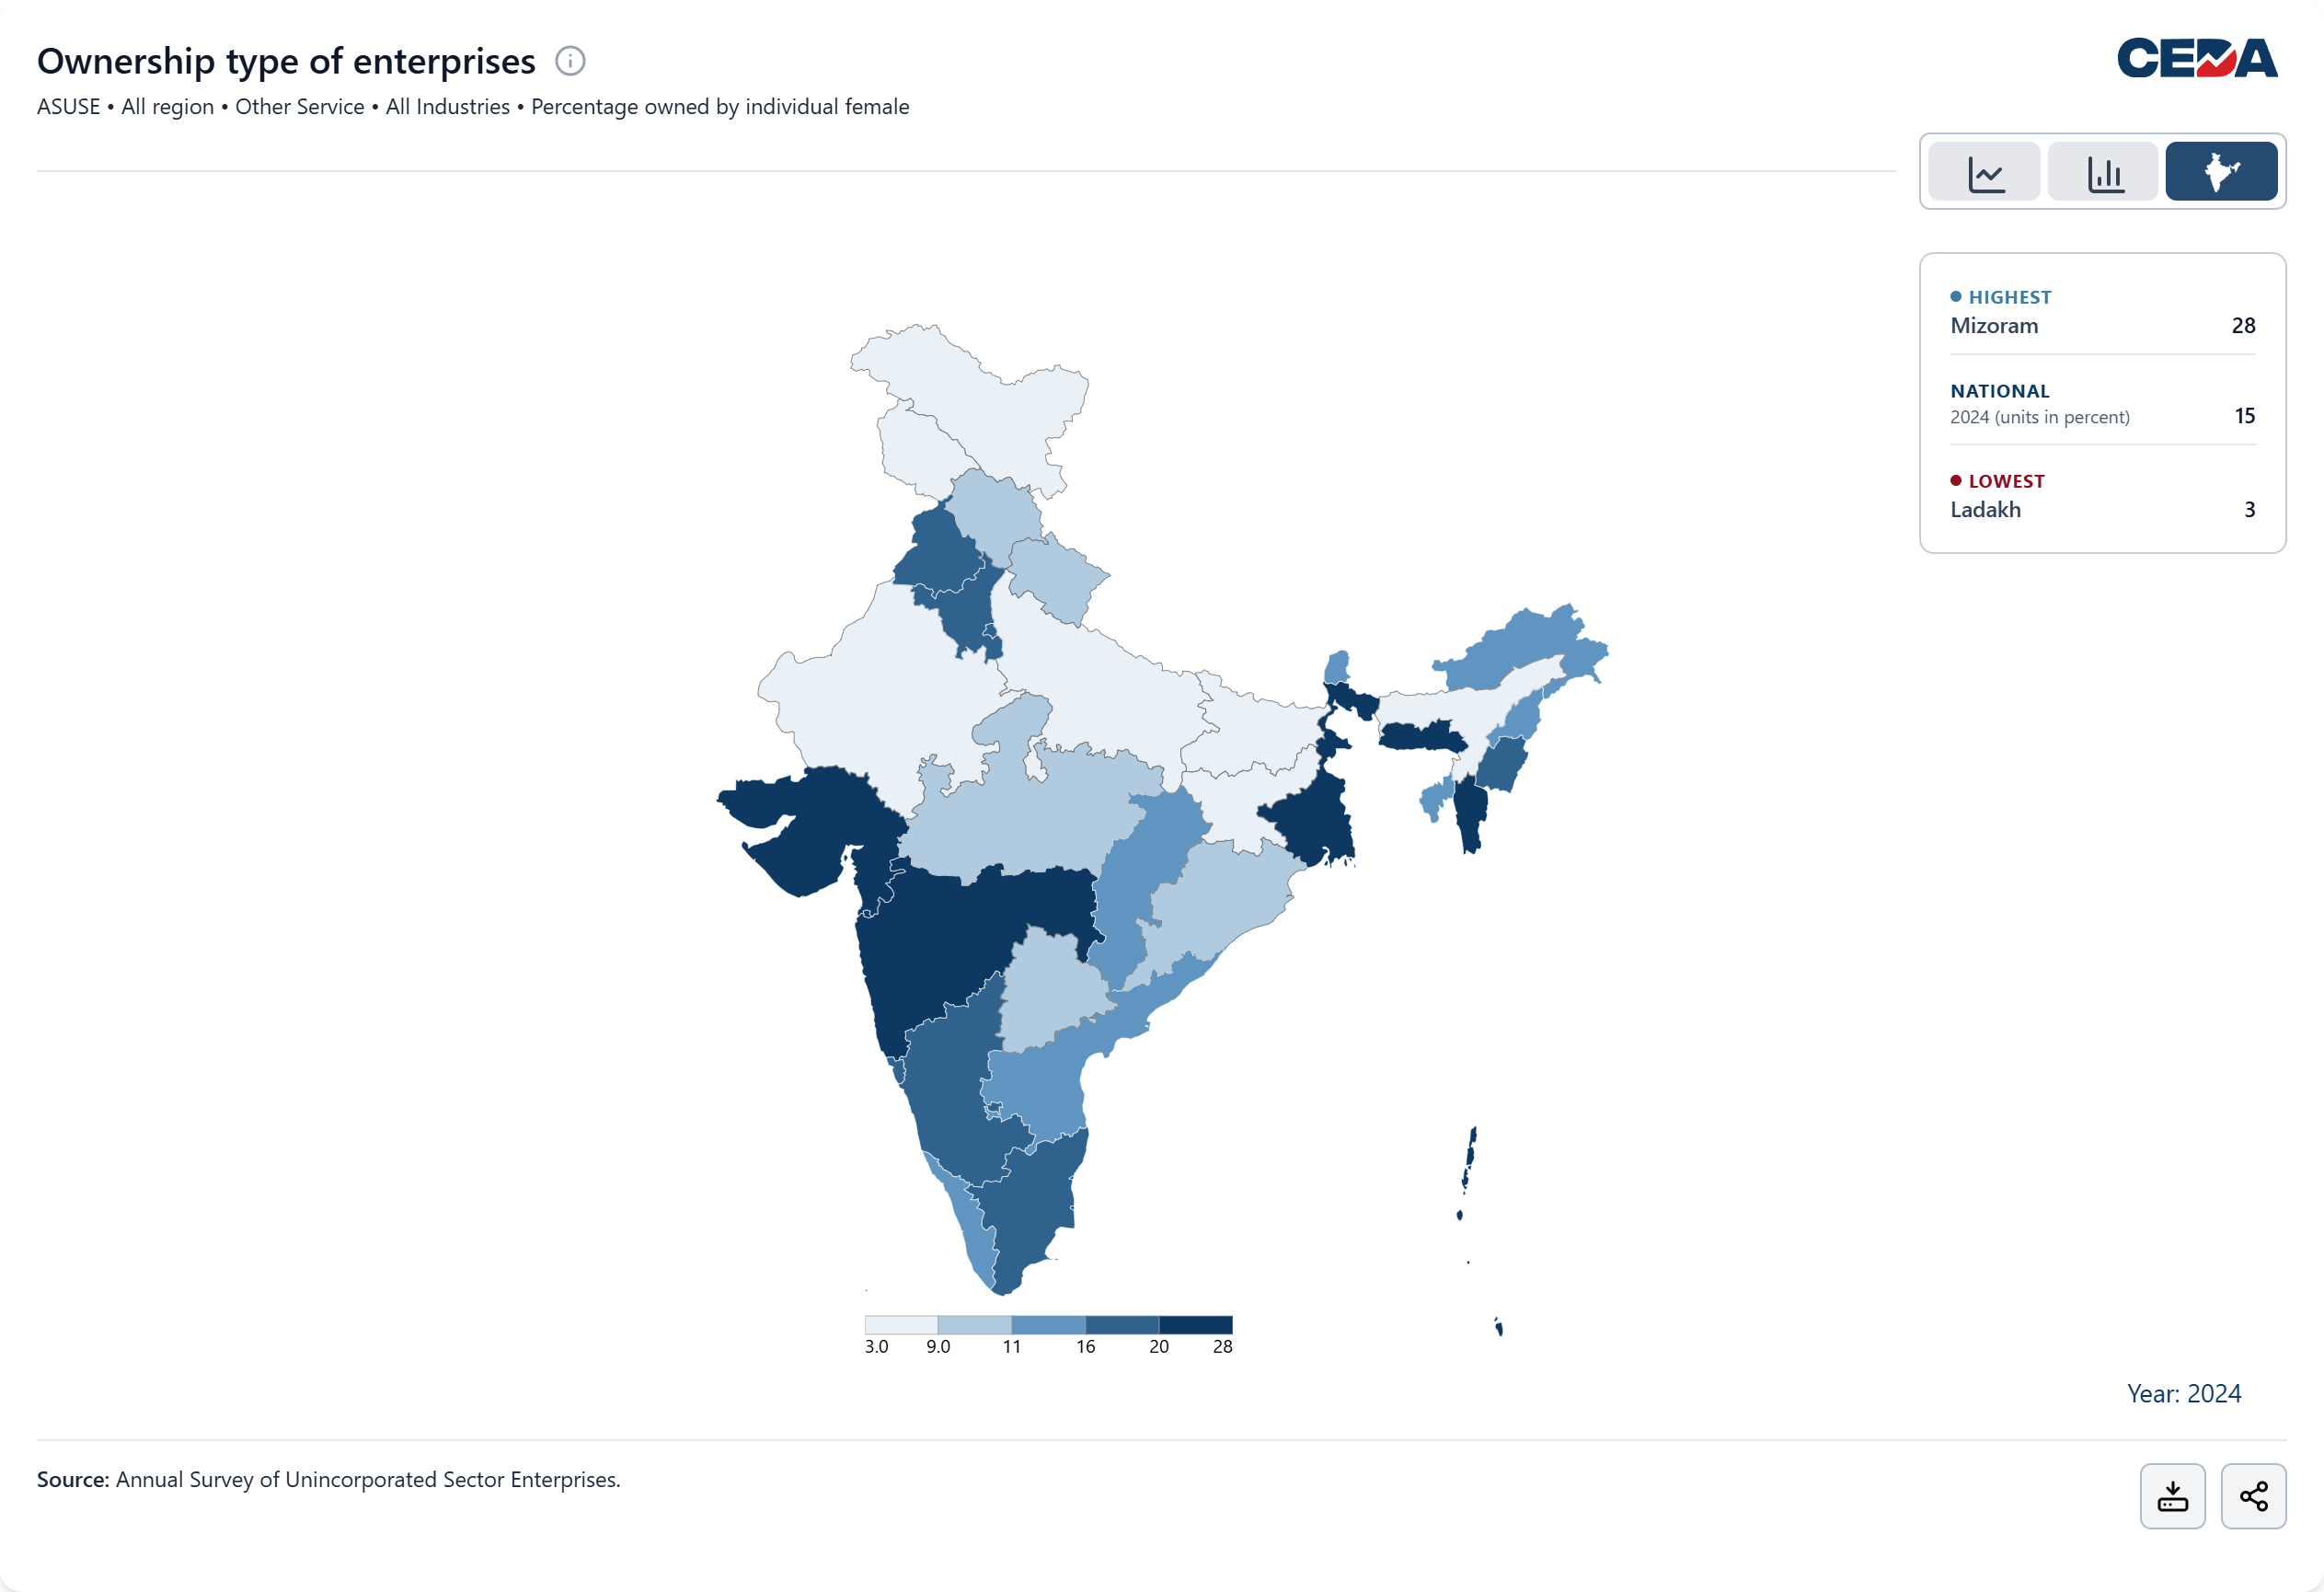
Figure 7 shows female ownership of enterprises engaged in services in 2024 across states. It ranges from 28.3 percent in Mizoram to 3.0 percent in Ladakh, a nearly 10-fold difference. States such as Mizoram, Dadra and Nagar Haveli and Daman and Diu, and Meghalaya report higher levels of participation, alongside Gujarat, West Bengal, and Maharashtra, which also feature among the top-performing states. In contrast, most states remain at or below the national average of 14.7 percent, with several, including Uttar Pradesh, Bihar, and Rajasthan, recording particularly low shares, often below 10 percent.
Women’s ownership of enterprises in India is rising, but the gains are uneven and unevenly sustained across sectors and states. The contrast between higher ownership in manufacturing and persistently lower shares in trade and services, alongside sharp regional variation, points to structural differences in where women are able to own enterprises. This is not a uniform story of progress, but one shaped by sectoral and geographic constraints. For policy, the challenge is not just to increase ownership overall, but to address the conditions that limit where and how women can own enterprises.
CEDA has launched Economic Enterprises Data Tracker, a new tool that brings India’s formal and informal enterprises into a single, comparable view. Drawing on ASI, ASUSE, and earlier NSS rounds, it standardises key indicators on investment, productivity, credit, employment, and enterprise characteristics. Users can explore each survey separately or compare trends across sectors using harmonised data. With interactive charts, state-level insights, and downloadable datasets, the tracker provides a clearer, consolidated view of India’s enterprise economy for research and policy use.
To cite this analysis: Sneha Thomas (2026), “Expanding, Yet Unequal: The Story of Women-Owned Informal Enterprises in India” Centre for Economic Data and Analysis (CEDA), Ashoka University. Published on ceda.ashoka.edu.in