Made in Humane Club


Key highlights
- In 2024, nearly nine out of ten enterprises in the informal manufacturing sector operated without regular hired workers.
- OBC-owned enterprises accounted for more than half of all informal manufacturing enterprises in 2024.
- Home-based enterprises continue to dominate India’s informal manufacturing sector, with nearly seven in ten enterprises operating from within households across all survey rounds between 2011 and 2024.
- In 2024, roughly 1 in 6 informal manufacturing enterprises in India used the internet.
India’s informal manufacturing sector remains an important component of the country’s enterprise economy and a key source of livelihoods. According to the Annual Survey of Unincorporated Sector Enterprises (ASUSE) 2024, the sector comprised 2.02 crore enterprises, accounting for 27.5 percent of all unincorporated non-agricultural enterprises, and employed nearly 3.4 crore workers across the country. CEDA’s earlier analysis showed that women account for 58.4 percent of enterprise owners in this sector, highlighting the need to move beyond ownership patterns and examine how these enterprises are organised and function in practice. This article, therefore, focuses on the internal structure of informal manufacturing enterprises, including their employment arrangements, ownership across social groups, location of operation, and internet adoption.
The analysis draws on unit-level data on unincorporated non-agricultural enterprises from the National Sample Survey (NSS) 67th round (2010-11) and 73rd round (2015-16), along with the ASUSE, visualised through CEDA’s Economic Enterprise Tracker. These datasets together provide a basis for understanding the distribution and characteristics of informal manufacturing enterprises across states, while highlighting the structural disparities that continue to shape the sector.
Nearly nine in ten informal manufacturing units operate without hired workers
In ASUSE, enterprises are categorised according to their employment structure into own-account enterprises (OAEs) and hired-worker enterprises (HWEs). OAEs are enterprises run by the owner and/or unpaid family members, without any regular hired workers. By contrast, HWEs are those that employ at least one worker on a regular hired basis in addition to the owner or family members.
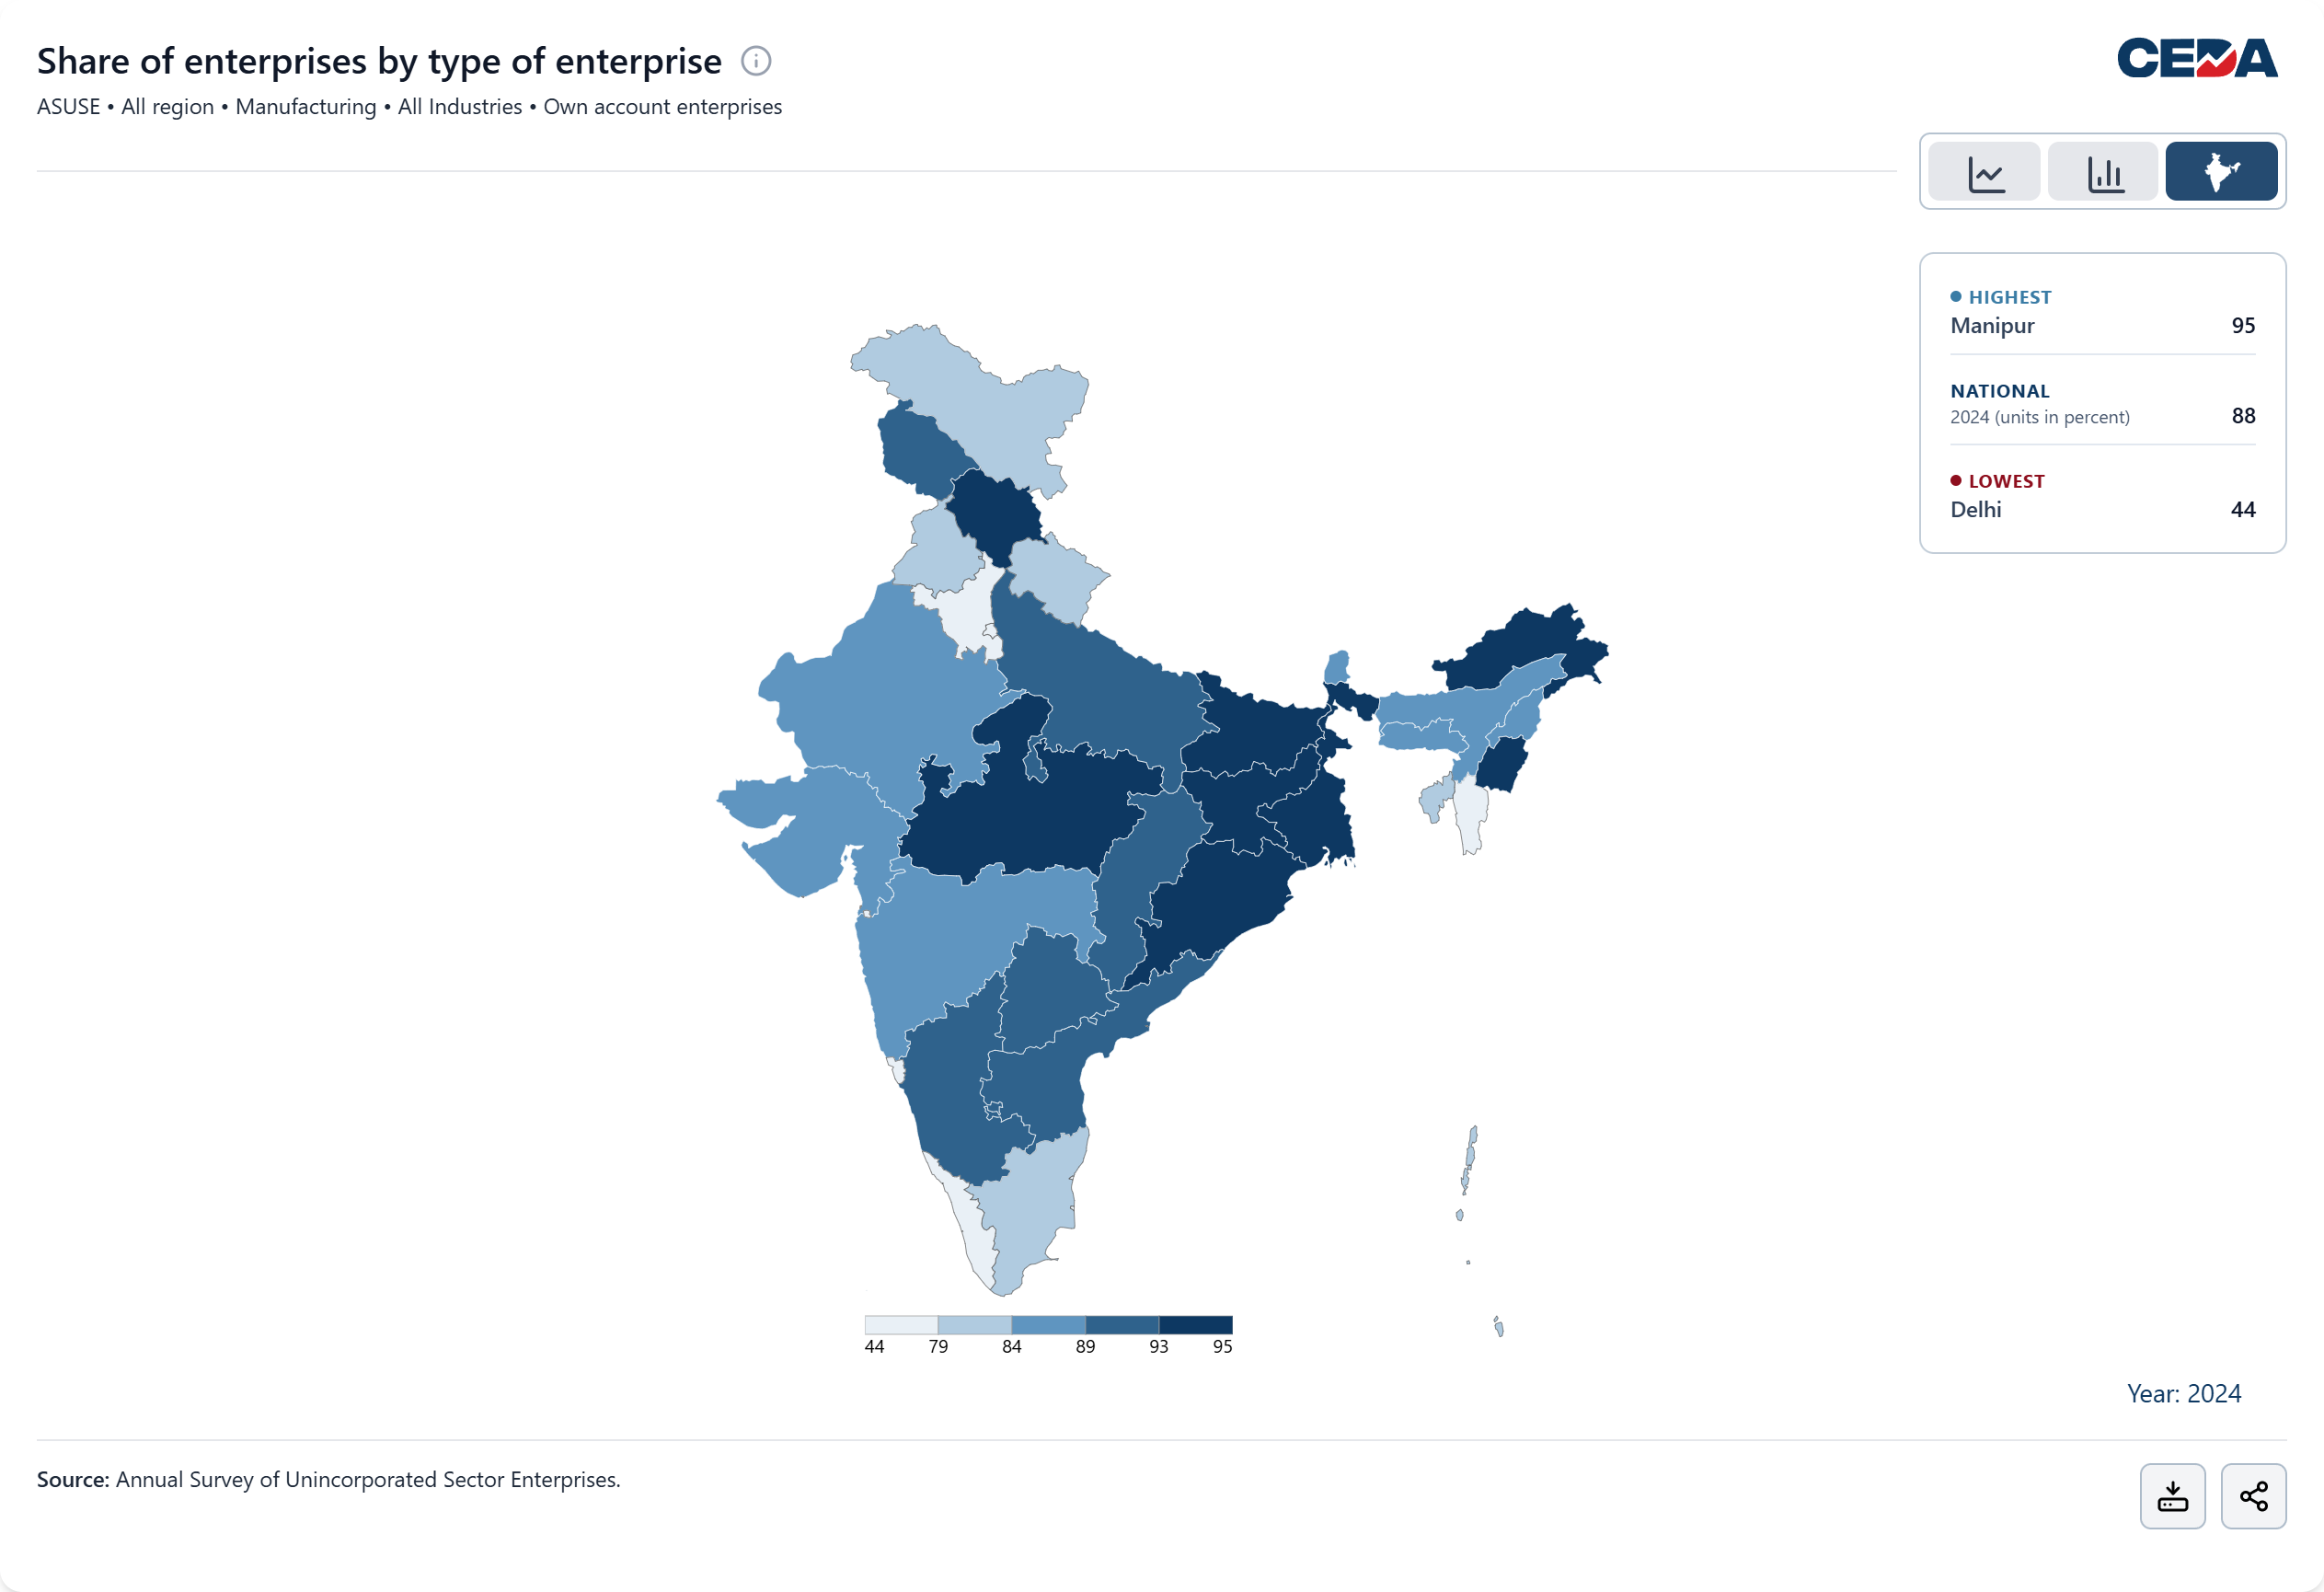
Figure 1 shows that in 2024, own-account enterprises constituted 88.3 percent of all informal manufacturing enterprises in India, meaning nearly nine out of ten operated without regular hired workers. Their share ranged from nearly 95 percent in Manipur to 44.5 percent in Delhi, where own-account enterprises nevertheless continued to account for almost half of all enterprises.
OBCs account for the largest share of informal manufacturing enterprises, while ST ownership is regionally concentrated
ASUSE classifies the owners of unincorporated enterprises using the broad administrative categories established for implementing reservations or affirmative action. They are classified as Scheduled Castes (SC), Scheduled Tribes (ST), Other Backward Classes (OBC), or “Others” — the residual category. This is the non-SC-ST-OBC population, which is a rough proxy for groups conventionally ranked higher in the socio-economic hierarchy, or the so-called “Upper Castes” (UC)
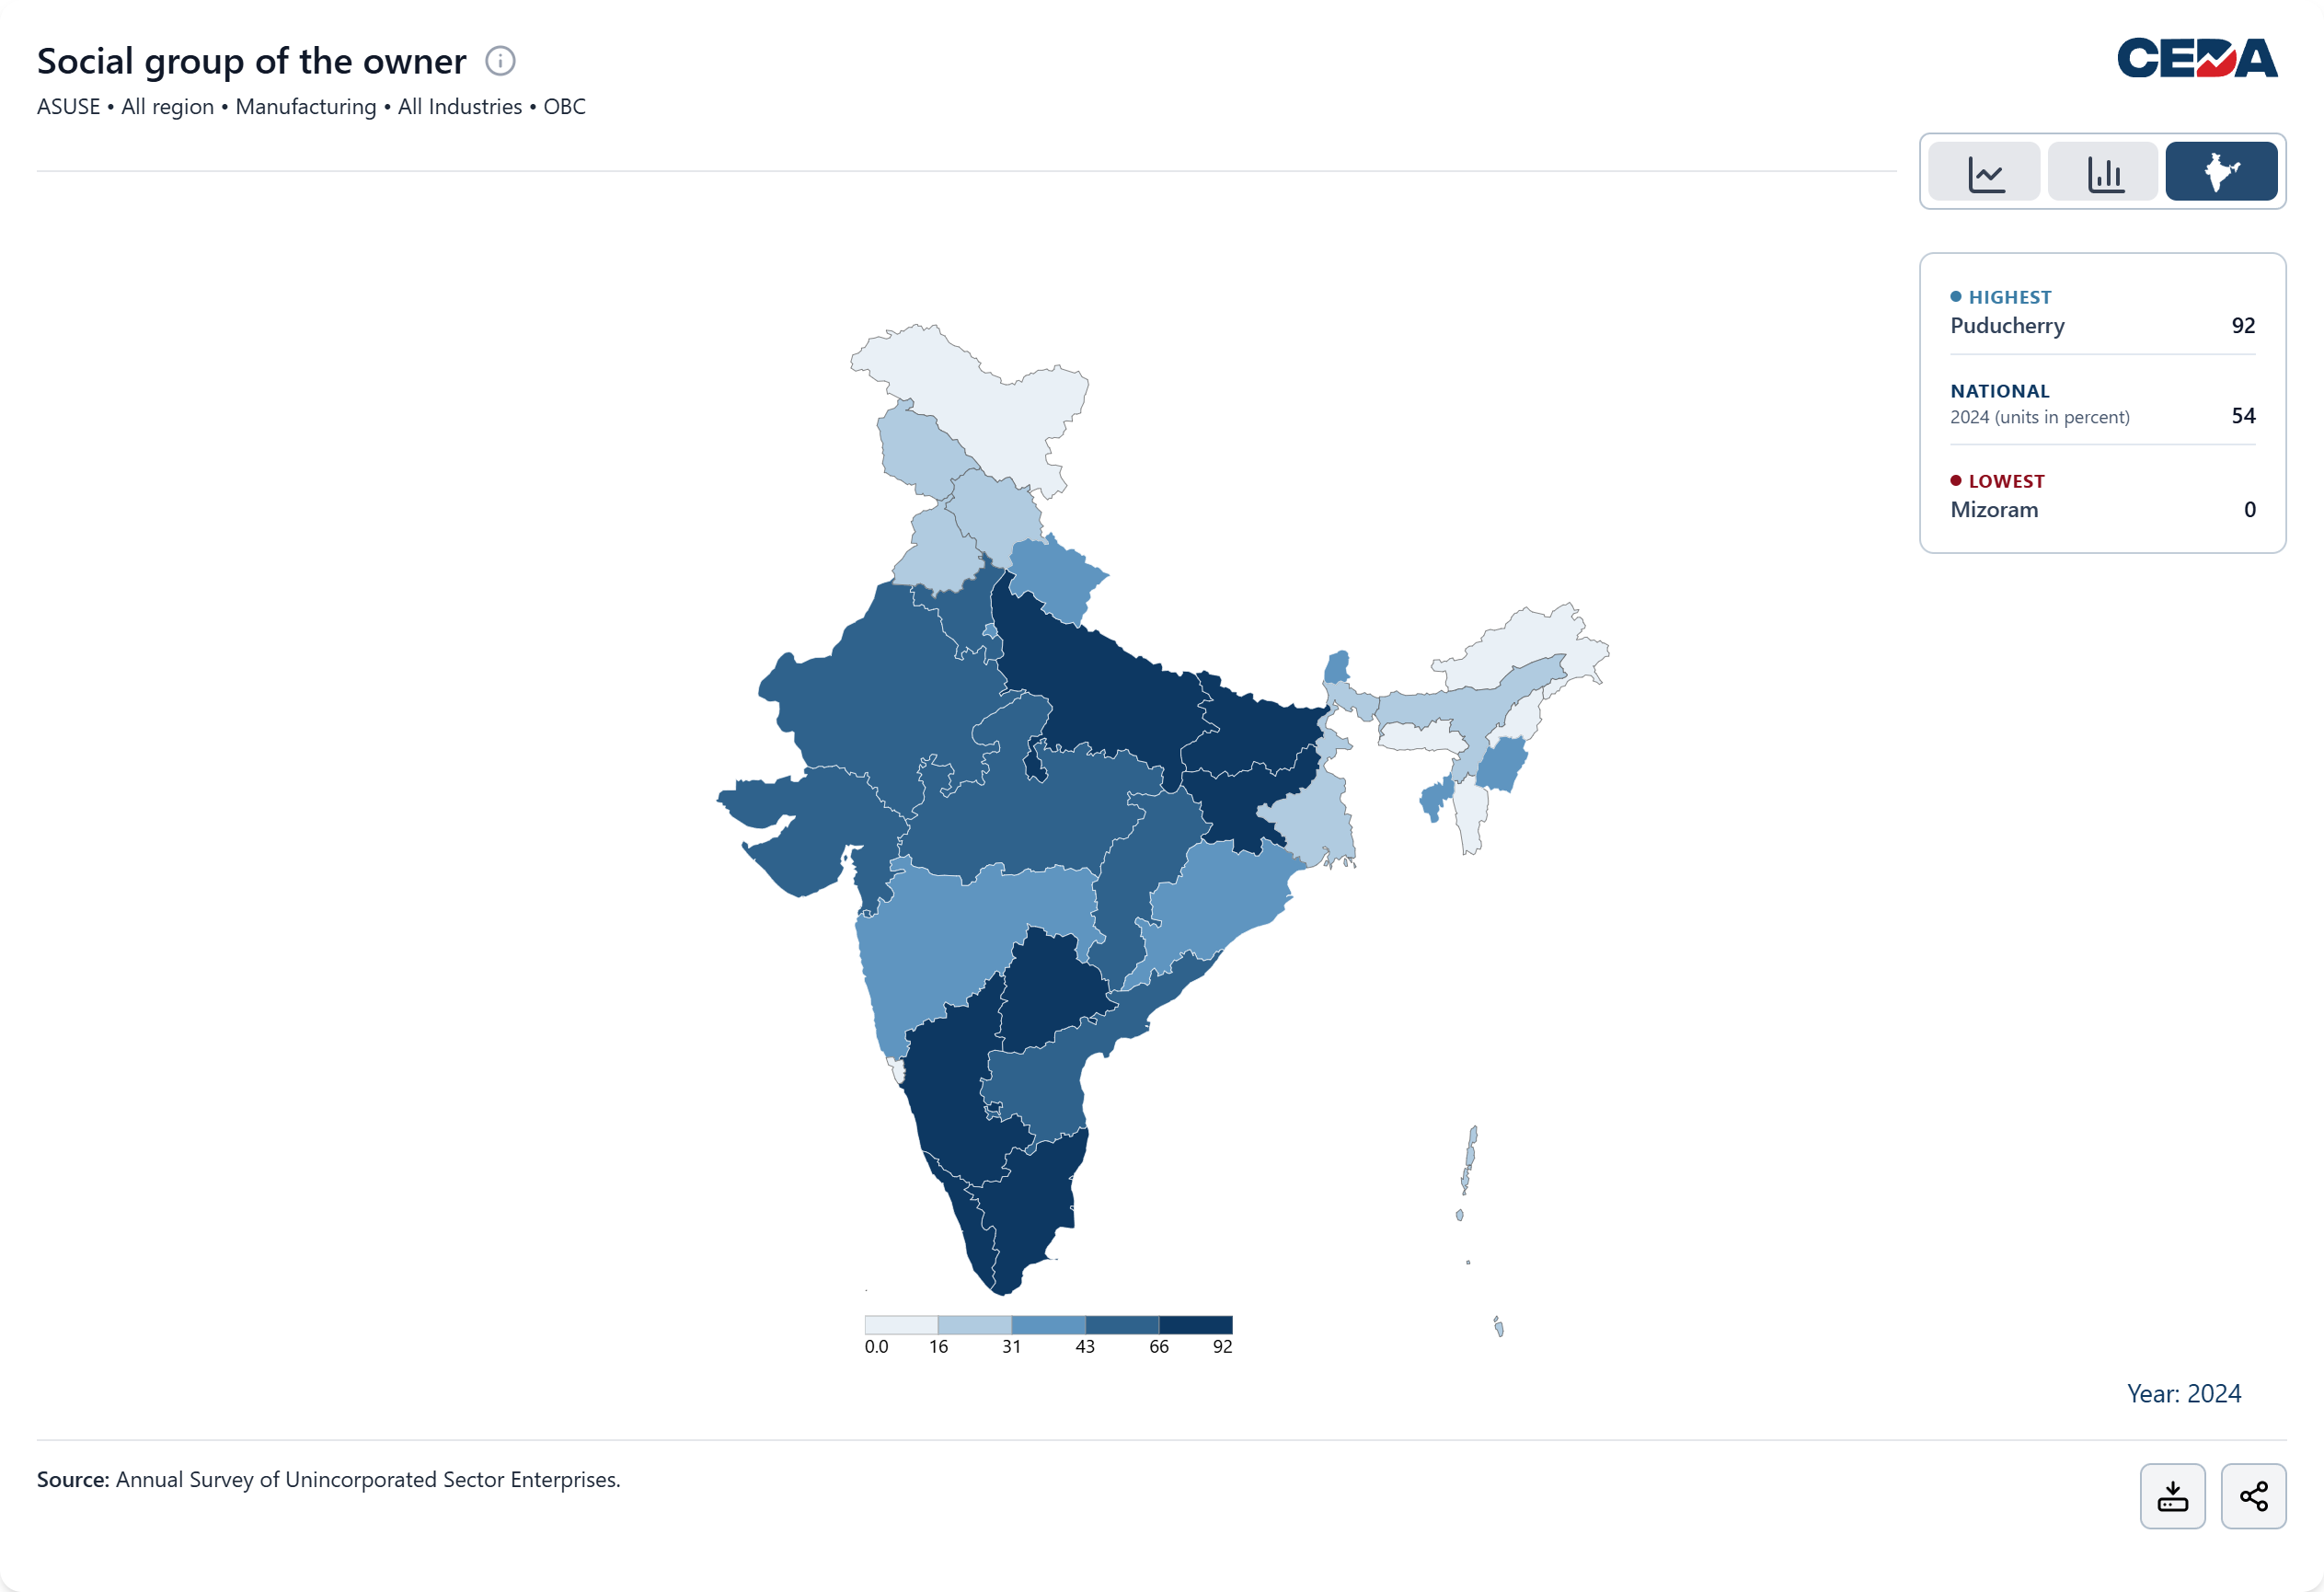
Figure 2 shows that OBC-owned enterprises accounted for 54.4 percent of all informal manufacturing enterprises in 2024, though their share varied considerably across states. Among the major states, the share was highest in Tamil Nadu, where OBC-owned enterprises constituted nearly nine in ten enterprises (87.6 percent), followed by Bihar (80.6 percent) and Telangana (79.6 percent). At the other end, states such as Punjab (29.5 percent), Assam (28.4 percent), and West Bengal (18.4 percent) reported considerably lower shares.
The share of OBC-owned enterprises does not always correspond to the OBC population share in a state. In West Bengal, OBC-owned enterprises account for 18.4 percent of informal manufacturing enterprises, a share lower than their estimated population share of 25.3 percent (NSSO 68th Round, 2011-12). By contrast, in Bihar, where OBCs and EBCs (Extremely Backward Classes) together account for approximately 63.1 percent of the population (Bihar Caste Survey, 2023), OBC-owned enterprises account for 80.6 percent of informal manufacturing enterprises.
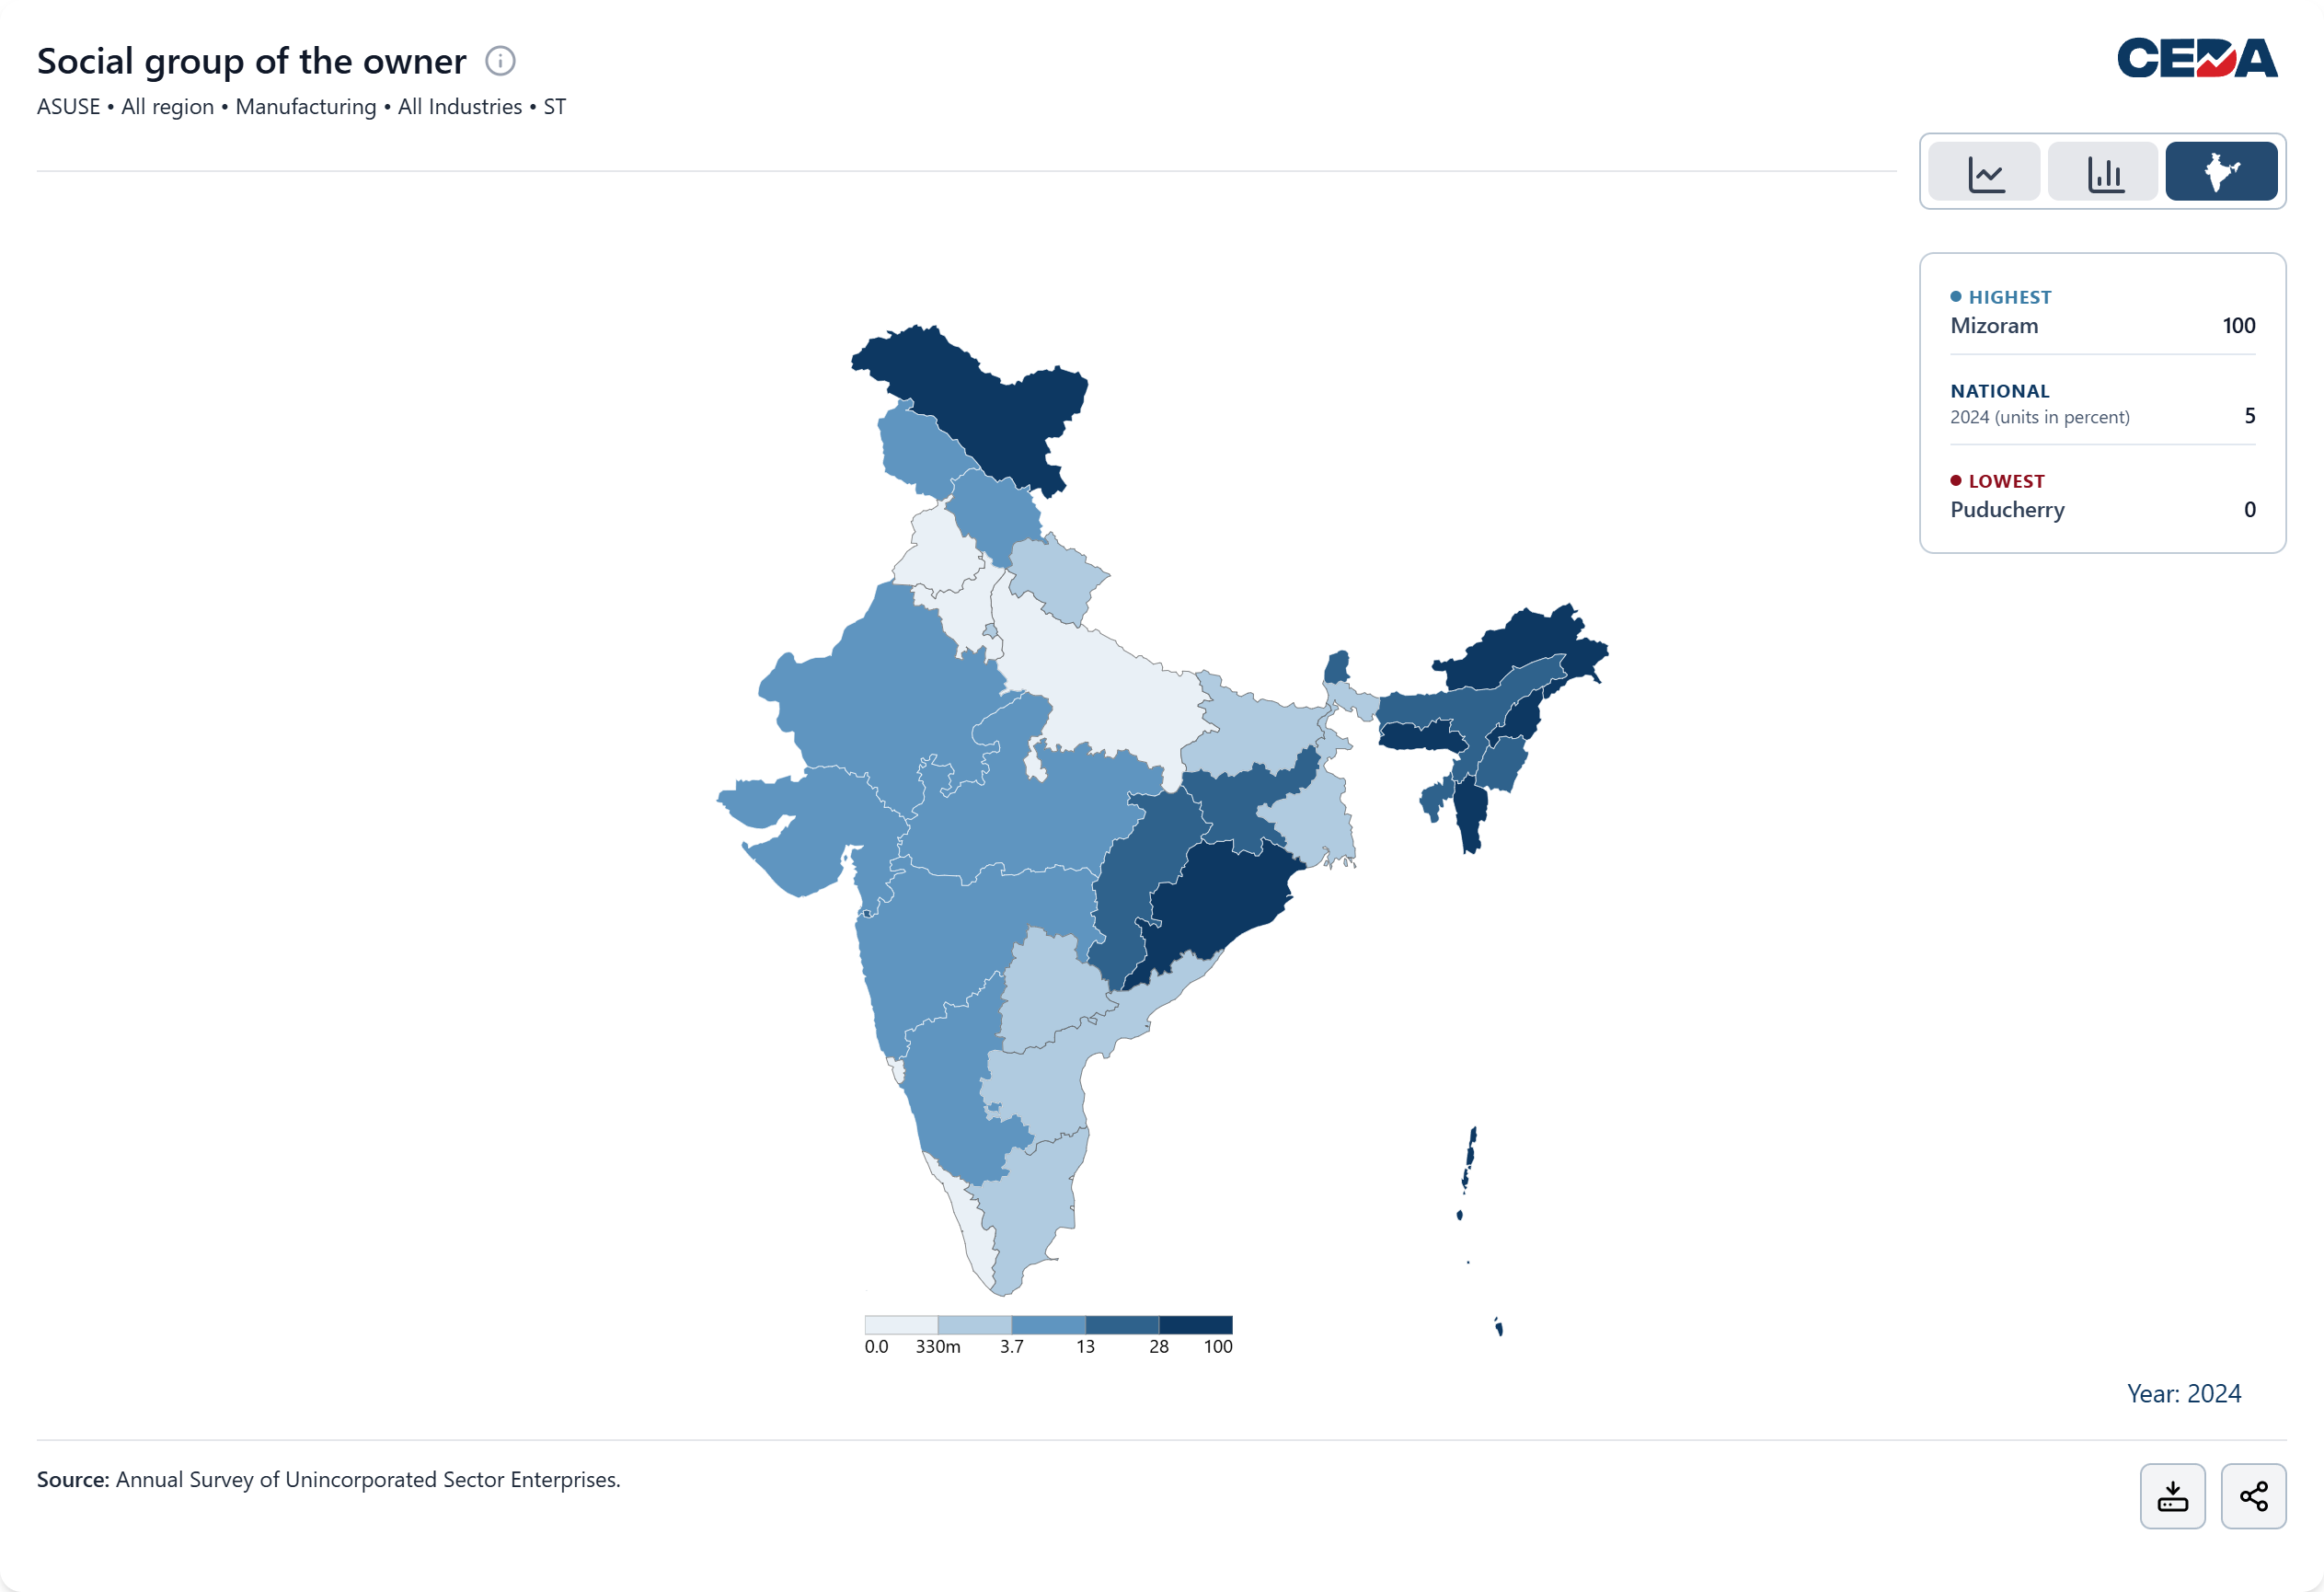
Figure 3 shows that in 2024, ST-owned enterprises accounted for 5 percent of all informal manufacturing enterprises in India. In Mizoram, where STs constitute around 94.4 percent of the population (Census 2011), ST-owned enterprises account for 100 percent of the state’s informal manufacturing enterprises. Similarly, in Nagaland, Meghalaya, and Lakshadweep, where STs constitute 86.5 percent, 86.1 percent, and 94.8 percent of the population respectively (Census 2011), ST-owned enterprises account for more than 90 percent of informal manufacturing enterprises in each state.
However, some states record lower levels of ST enterprise ownership relative to their population share. In Jharkhand, STs constitute 26.2 percent of the population (Census 2011) but account for only 12.8 percent of informal manufacturing enterprises. Similarly, in Chhattisgarh, STs comprise 30.6 percent of the population (Census 2011) but own 19.1 percent of such enterprises.
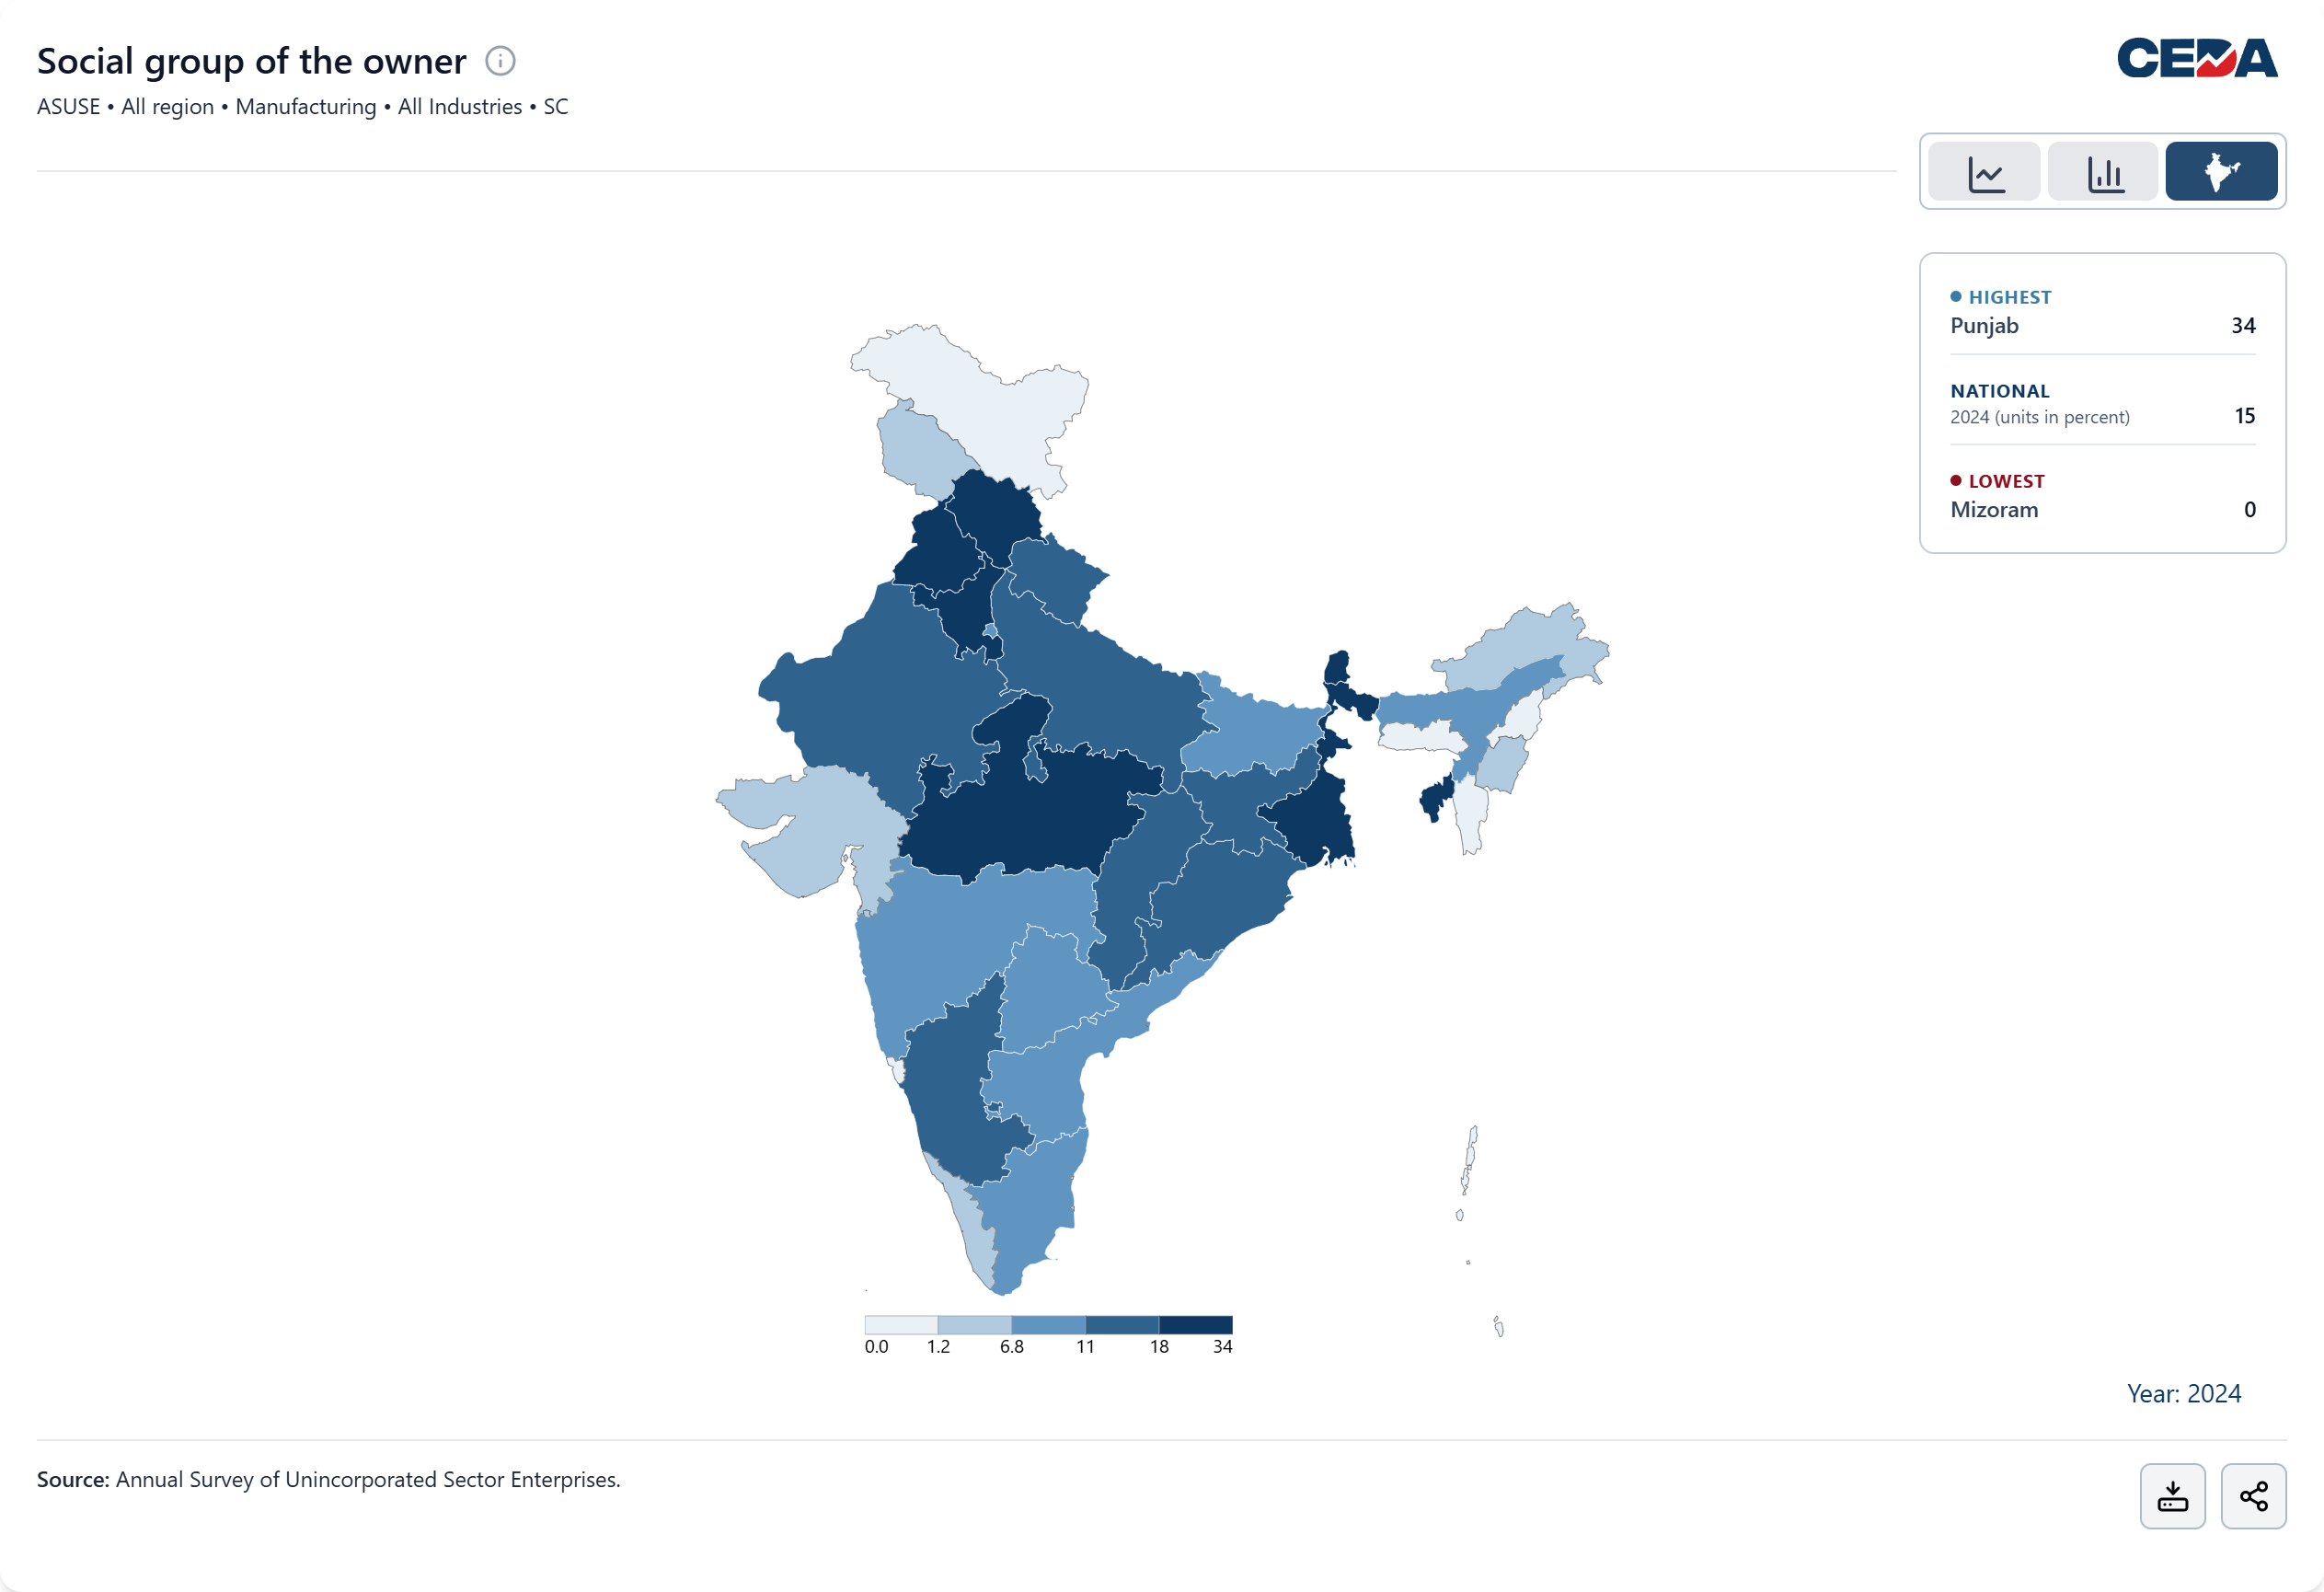
Figure 4 shows that SC-owned enterprises account for about 1 in 7 informal enterprises (15 percent) in India’s manufacturing sector in 2024. Punjab, which has the highest percentage of SC population in India (31.9 percent, Census 2011), also records the highest enterprise share at 34.4 percent, followed by Chandigarh (31.9 percent) and Himachal Pradesh (29.2 percent). However, this alignment is not consistent across states. Tamil Nadu, where SC population share stands at around 20 percent (Census 2011), records a lower enterprise share at 8.6 percent.
Household-based enterprises dominate informal manufacturing in India
ASUSE classifies enterprises by location into three categories: those operating within household premises; those operating outside the household from fixed premises such as a shop, stall, or workshop; and those operating outside the household without a fixed premises, such as mobile or temporary units.
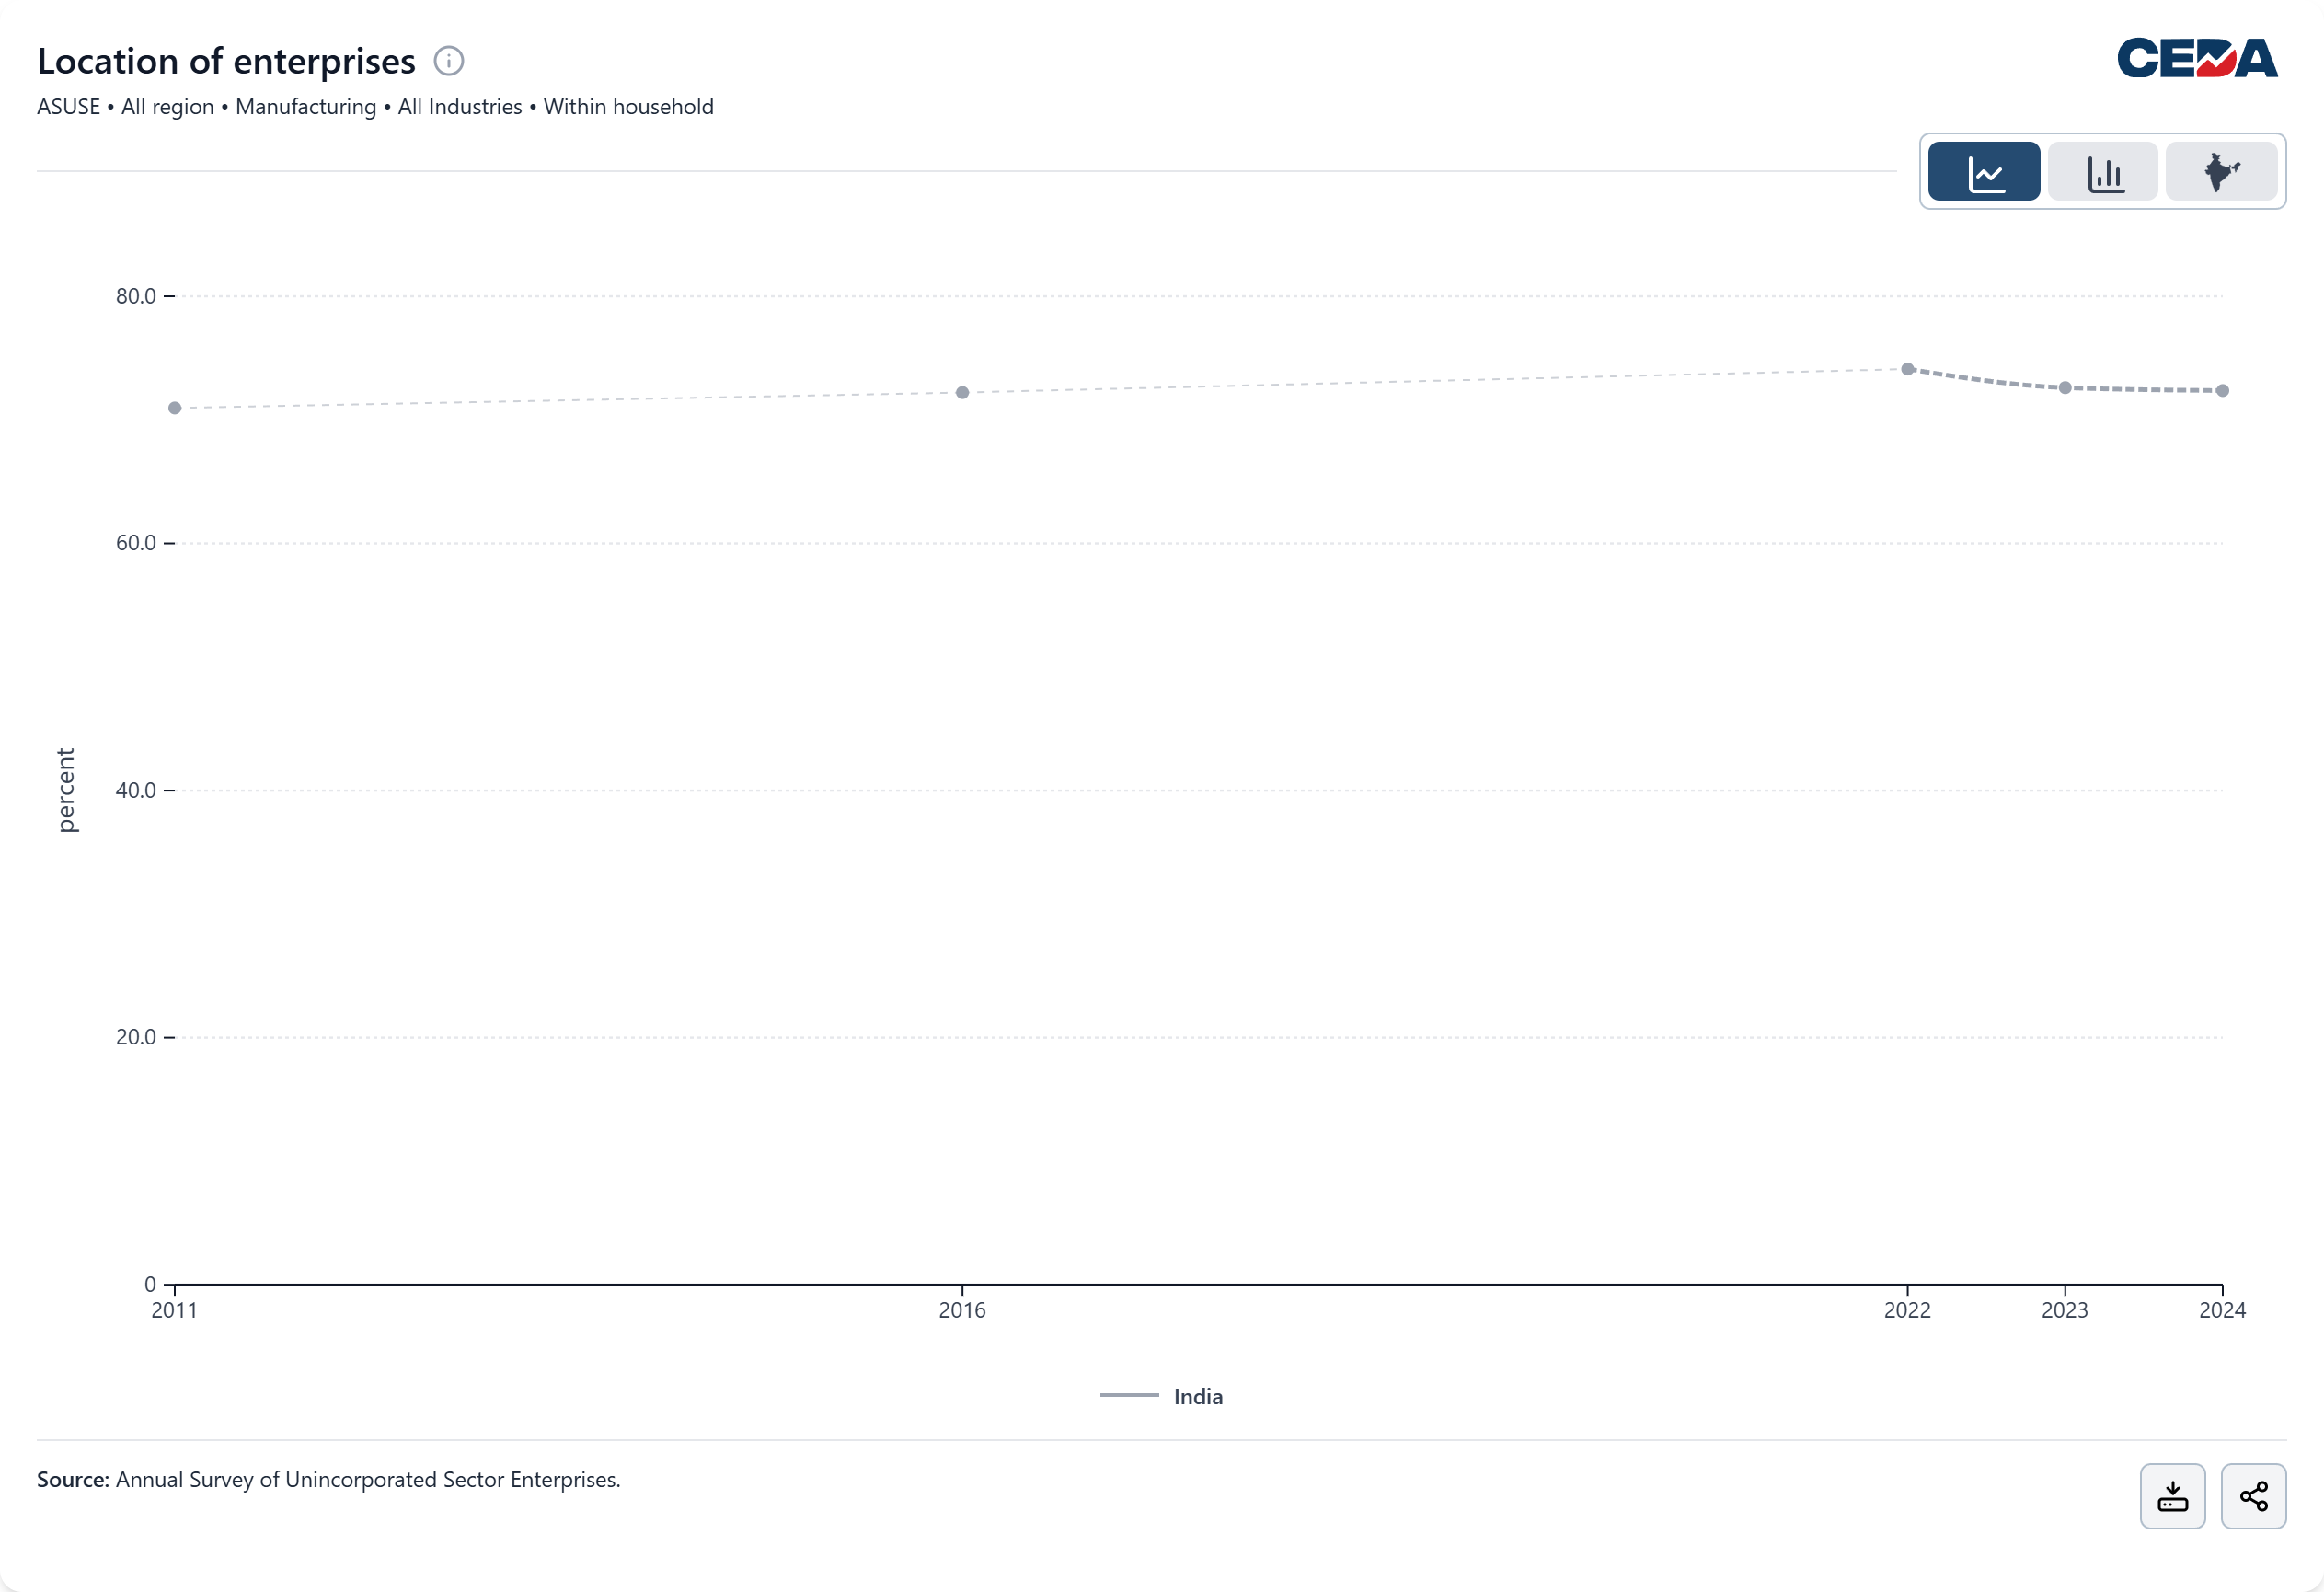
Figure 5 shows that around 7 in 10 informal manufacturing enterprises operate from within households, a pattern that has remained broadly stable over time. The share rose from 70.9 percent in 2011 to a peak of 74.1 percent in 2022, before easing slightly to 72.3 percent in 2024.
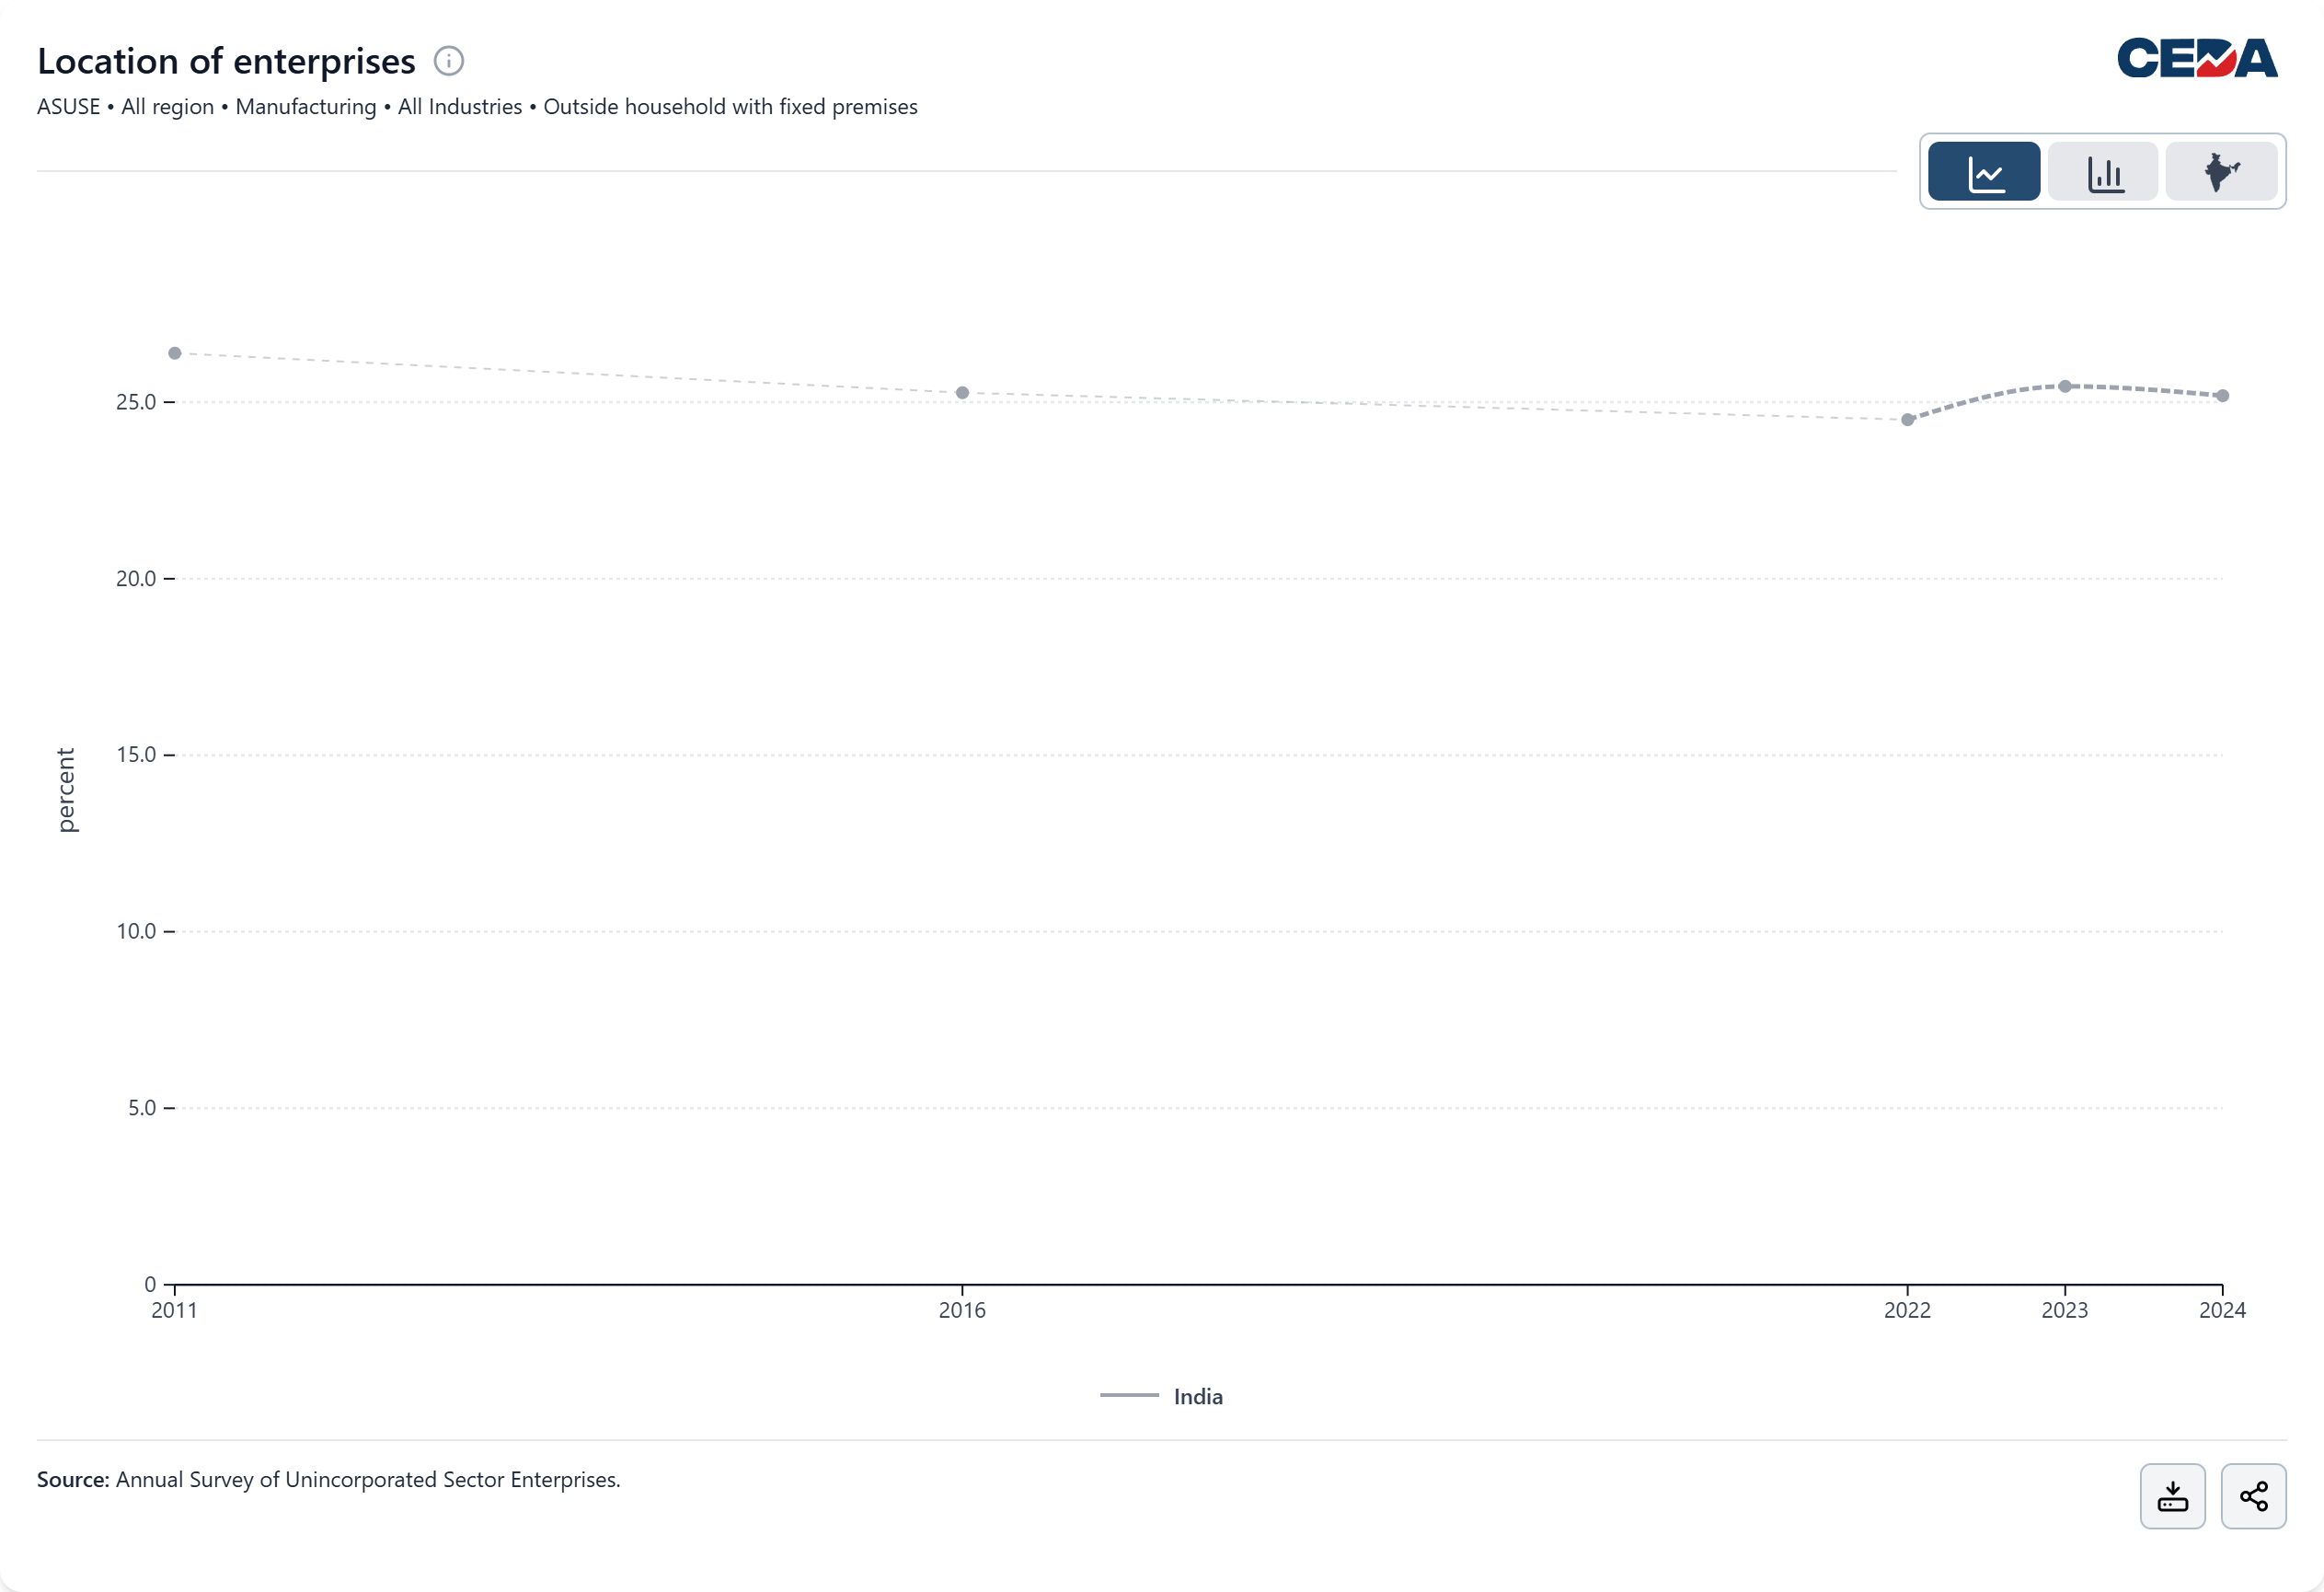
Enterprises operating outside the household are classified into those with and without fixed premises. Figure 6 shows that those with fixed premises account for about 1 in 4 informal manufacturing enterprises, declining from 26.3 percent in 2011 to 24.5 percent in 2022, before rising slightly to 25.2 percent in 2024.
The remaining 2.5 percent in 2024 are enterprises operating outside households without fixed premises.
Only 1 in 6 informal manufacturing enterprises use the internet, with adoption highly skewed across states
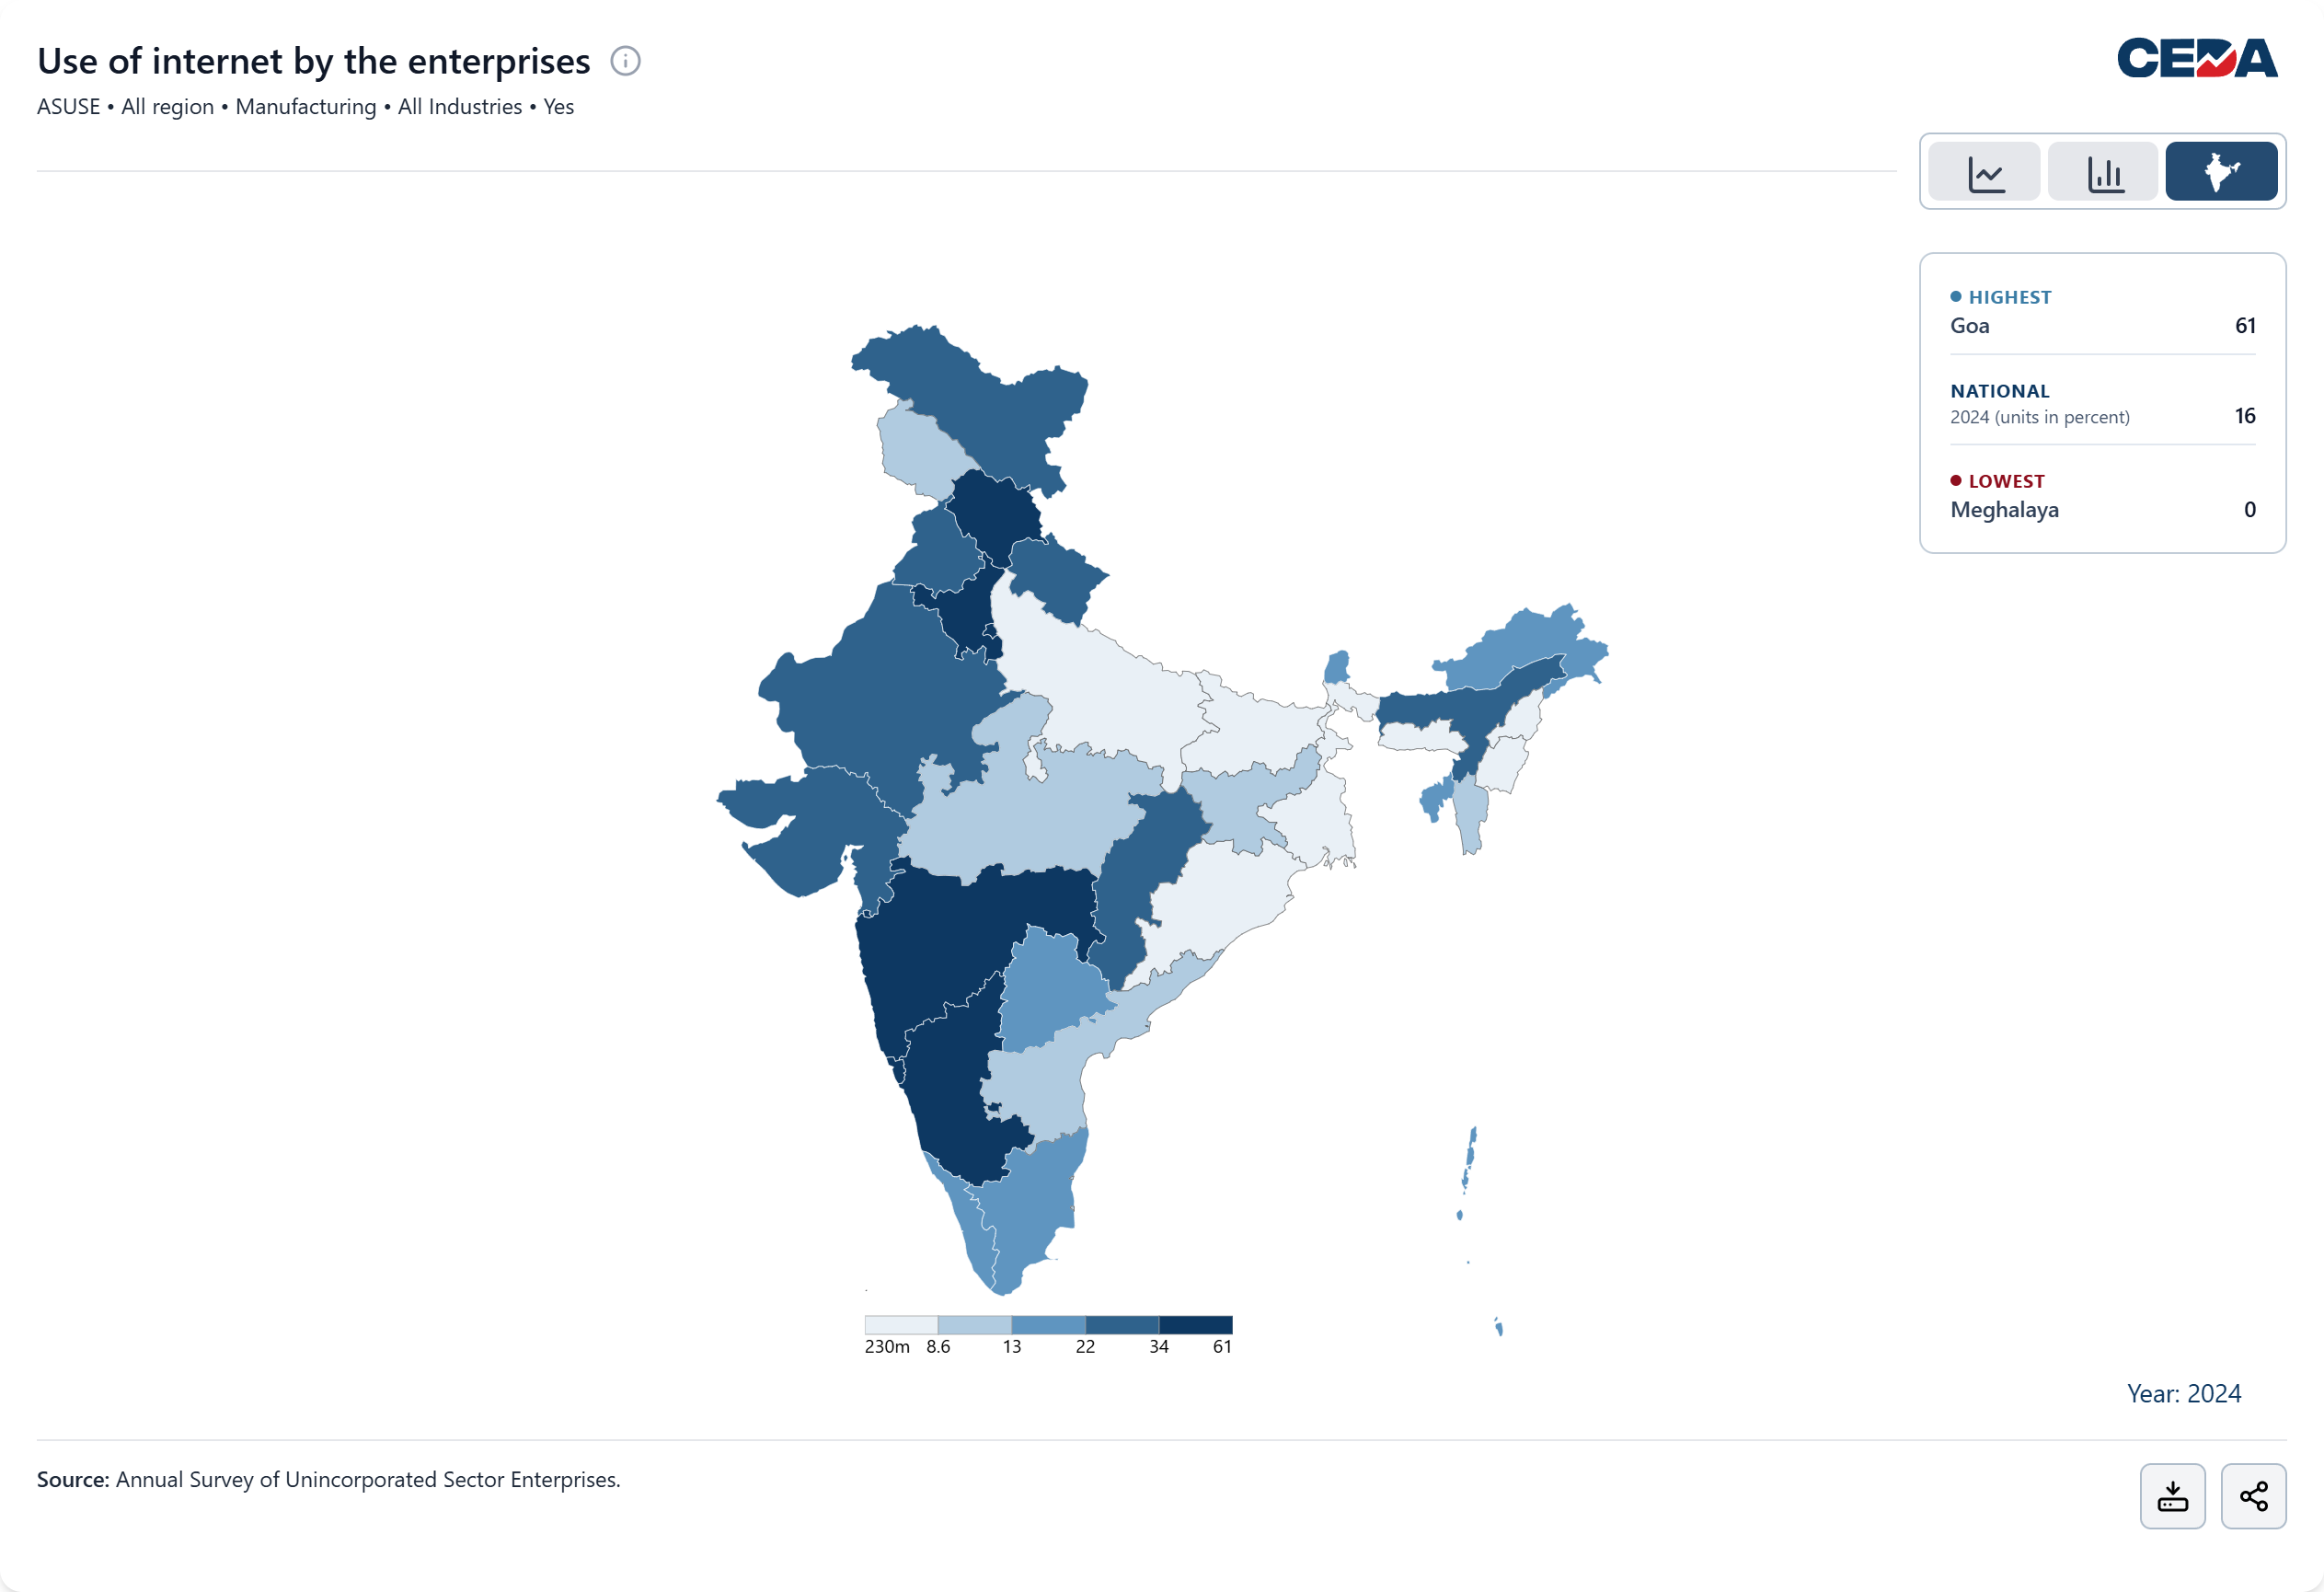
Figure 7 shows that in 2024, roughly 1 in 6 informal manufacturing enterprises (16 percent) in India used the internet. Goa (61 percent), Dadra and Nagar Haveli and Daman and Diu (56.2 percent), and Delhi (50 percent) reported the highest usage— all well above the national average (16 percent). Karnataka and Maharashtra (both 34.5 percent) recorded relatively higher uptake, while Tamil Nadu (15.7 percent), Andhra Pradesh (11.6 percent), and Kerala (13 percent) remained at or below the national average, suggesting that internet diffusion within informal manufacturing has not kept pace with broader gains in digital access in these states. Uttar Pradesh records one of the lowest levels of adoption (2.6 percent), alongside Manipur (0.3 percent) and Meghalaya (0.2 percent).
Overall, informal manufacturing in India remains characterised by small, self-operated, and household-based enterprises, with limited internet adoption. Given that women account for a majority of enterprise owners in the sector, these structural features have important implications for a large share of India’s entrepreneurs. While patterns of ownership and operation vary across states, the predominance of own-account enterprises and low levels of digital adoption point to persistent barriers to enterprise expansion and productivity growth. Addressing these constraints will be critical to enhancing the sector’s broader economic potential.
CEDA has launched Economic Enterprises Data Tracker, a new tool that brings India’s formal and informal enterprises into a single, comparable view. Drawing on ASI, ASUSE, and earlier NSS rounds, it standardises key indicators on investment, productivity, credit, employment, and enterprise characteristics. Users can explore each survey separately or compare trends across sectors using harmonised data. With interactive charts, state-level insights, and downloadable datasets, the tracker provides a clearer, consolidated view of India’s enterprise economy for research and policy use.
To cite this analysis: Sneha Thomas (2026), “Beyond ownership: Inside India’s informal manufacturing sector” Centre for Economic Data and Analysis (CEDA), Ashoka University. Published on ceda.ashoka.edu.in