
In April 2020, a team of researchers affiliated with the Centre for Disease Dynamics, Economics & Policy (CDDEP) and Princeton University provided a state-wise estimate of hospital beds, ICU beds and ventilators in India. This was done with the backdrop of the national lockdown in India imposed in March 2020. The last point in the summary of this presentation said, “Accommodation of influx of Covid-19 patients, will require rapid expansion of current capacity or modifications in admission policy for routine patient care.”
As India was hit by the second wave of the coronavirus pandemic this year, news reports about shortage of beds, lack of adequate oxygen supply and important medicines, showed us that these warnings from one year ago were not heeded. That a once-in-a-century pandemic was going to test India’s weak health infrastructure was expected but the second wave of the Covid-19 pandemic has laid bare the inadequacy of this infrastructure.
History shows that the ferocity of a pandemic’s second wave is expected. The Spanish Flu, a century ago, claimed nearly 18 million lives in India alone. The deadlier second wave of the Flu struck in the second year. That lesson from a century ago seemed to have been ignored over the last year when India could’ve prepared for the second wave of the coronavirus pandemic effectively.
The pandemic has put the focus on India’s inadequate health infrastructure. This is best demonstrated in Figure 1 below. In this graph, we show the number of hospital beds per 100,000 people in India and across different states. The calculations are based on data collected by CDDEP and Princeton University from the National Health Profile 2019. Figure 1 shows a national average of 142 beds per 100,000 Indians (population projections based on Census 2011 and released by the Ministry of Health and Family Welfare (MoHFW)).
Click on any state on the map to find out the number of beds per 100,000 people
Figure 1
As per the World Bank, India had only 53 beds per 100,000 people in 2017. This was lower than 63 for Pakistan, 79.5 for Bangladesh, 415 for Sri Lanka and 1298 for Japan. In terms of number of physicians per 100,000 people India had 85.7 in 2018 while Pakistan had 98, Bangladesh had 58.1, Sri Lanka had 100.4 and Japan had 241. These numbers show us how India’s healthcare system stacks up against its neighbours and a developed country like Japan.
To get a sense of India’s total healthcare expenditure in relation to its GDP, we can look at Figure 2 below [1]. According to the National Health Profile 2019, released by the MoHFW, India spent only 1.28 percent of its GDP on healthcare in 2017-18. This included all expenditure by the Centre and States/UTs.
Figure 2

The National Health Policy 2017, set India the target of spending 2.5 percent of GDP by the government on healthcare by year 2025. In healthcare accounting, this expenditure is classified as Government Health Expenditure (GHE). But Total Health Expenditure (THE) also includes other components like Out-of-Pocket Expenditure (OOPE). OOPE are expenses directly made by households at the point of receiving healthcare.
Out-of-Pocket Expenditure
According to Economic Survey 2020-21, “Increased prioritization of healthcare in the central and state budgets is important as it crucially impacts how much protection citizens get against financial hardships due to out-of-pocket payments made for healthcare (WHO 2010). OOPE for health increase the risk of vulnerable groups slipping into poverty because of catastrophic health expenditures [2].”
Figure 3 [3]shows that India has among the highest share of OOPE in THE. According to WTO, Out-of-Pocket Expenditure made up 62 percent of Total Health Expenditure in India in 2018. This aspect of poor governmental support in bearing the cost of healthcare has been exposed by the severe Covid-19 pandemic in the country. The Economic Survey further argues that “an increase in public health expenditure from the current levels in India to 3 per cent of GDP can reduce the OOPE expenditure from 60 per cent currently to about 30 per cent.”
Figure 3

Earlier, we have seen that the Covid-19 pandemic reversed India’s battle against extreme poverty. According to the Pew Research Centre, India saw a reduction in its middle-income population and an increase in poor population. This highlighted the negative impact of the pandemic on the most vulnerable sections of the population.
Similarly, high Out-of-Pocket Expenditure on health can be debilitating for the most vulnerable sections thereby necessitating an increase in government spending on healthcare.
In the Union Budget for 2021-22, presented in February 2021, the government allocated Rs 71,269 crores for healthcare. This was 9.6 percent more than the allocation made in Union Budget for 2020-21 (Rs 65,012 cr). However, the government ended up spending more on healthcare in 2020-21 owing to the Covid-19 pandemic and revised estimates (RE) for 2020-21 stood at Rs 78,866 cr. Thus, the healthcare budget for this year has in effect seen a decline rather than increase.
This poor allocation for healthcare is not in consonance with the Economic Survey’s stated objective of reducing the OOPE burden to 30 percent.
India’s Healthcare System in International Perspective
The Economic Survey also notes [4] that, “Despite improvements in healthcare access and quality (healthcare access and quality scored at 41.2 in 2016, up from 24.7 in 1990), India continues to underperform in comparison to other Low and Lower Middle Income (LMIC) countries. On quality and access of healthcare, India was ranked 145th out of 180 countries (Global Burden of Disease Study 2016). Only few sub-Saharan countries, some pacific islands, Nepal and Pakistan were ranked below India.”
India ranks 179th out of 189 countries in prioritizing health in government budgets (Union and state governments). Figure 4 below (from Economic Survey 2020-21), shows that India ranks amidst donor dependent countries like Haiti and Sudan.
Figure 4

State spending on healthcare
According to National Health Accounts Estimates 2016-17, states account for 68.6 percent of all Government Health Expenditure (GHE), with the Centre making up most of the rest. This shows the importance of state expenditure in Indian healthcare. In Figure 5 below, we explore total state government spending on healthcare on per capita basis over a period of ten years, 2010-11 to 2019-20 [5]. Total state government spending on healthcare includes two components, viz. revenue expenditure on healthcare and capital disbursement for healthcare. Figure 5 shows the change in per capita expenditure by state governments on healthcare. For example, Delhi spent Rs 1,367 per capita on healthcare in 2010-11 which increased to Rs 2,938 in 2019-20. If we rank these 21 states based on per capita expenditure in that particular year, Delhi is ranked 1st through most of this ten-year period but takes the 3rd spot in 2020-21, with J&K upstaging it. Bihar, Jharkhand, and Uttar Pradesh are the three states closest to the bottom in this ten-year period. We also see significant changes in states’ rankings in this period. Andhra Pradesh drops from being ranked 4th in 2010-11 to 17th in 2019-20. On the other hand, Odisha, Chhattisgarh, and Assam show sharp improvement in their rankings going from 20 to 9, 16 to 6, and 11 to 4 respectively.
Figure 5
According to NHA 2016-17 [6] (published in October 2019), there is great variation between states when it comes to share of OOPE in THE. Lowest share of OOPE among states is seen in Himachal Pradesh with 46.4 percent of expenditure coming out of pocket while the highest is seen in Bihar with 77.6 percent share. This is reflected in these states’ GHE share as well with HP reporting the highest per capita GHE spend at Rs 2816 while Bihar has the lowest per capita GHE at only Rs 500. See Figure 6 below:
Figure 6

Source: P 45, National Health Accounts Estimates for India 2016-17
Figure 6 shows that Kerala has the highest per capita Total Health Expenditure (THE) in the country at Rs 8,083. 67 percent of this THE is made up by OOPE even in Kerala. At Rs 5,960 per capita THE, Punjab ranks number two with 77 percent of this made up by OOPE, suggesting poor government support to healthcare. The lowest per capita THE is seen in Jharkhand at only Rs 2,313 followed by Bihar at Rs 2,358.
The difference between health expenditures in Kerala and Jharkhand or Bihar is so high that per capita THE in Bihar or Jharkhand is only one-third of Kerala’s per capita THE.
Are high shares of OOPE in various states related to poverty rates in these states? We explore this in Figure 7 below. The figure plots OOPE as percentage of Total Health Expenditure (THE) vs Poverty Rate in those states. While we don’t see a very strong pattern between OOPE spends in states with respect to prevalent state poverty rate, some of the poorest states (UP, Bihar, MP, and Odisha) have a very high share of OOPE in THE.
Figure 7
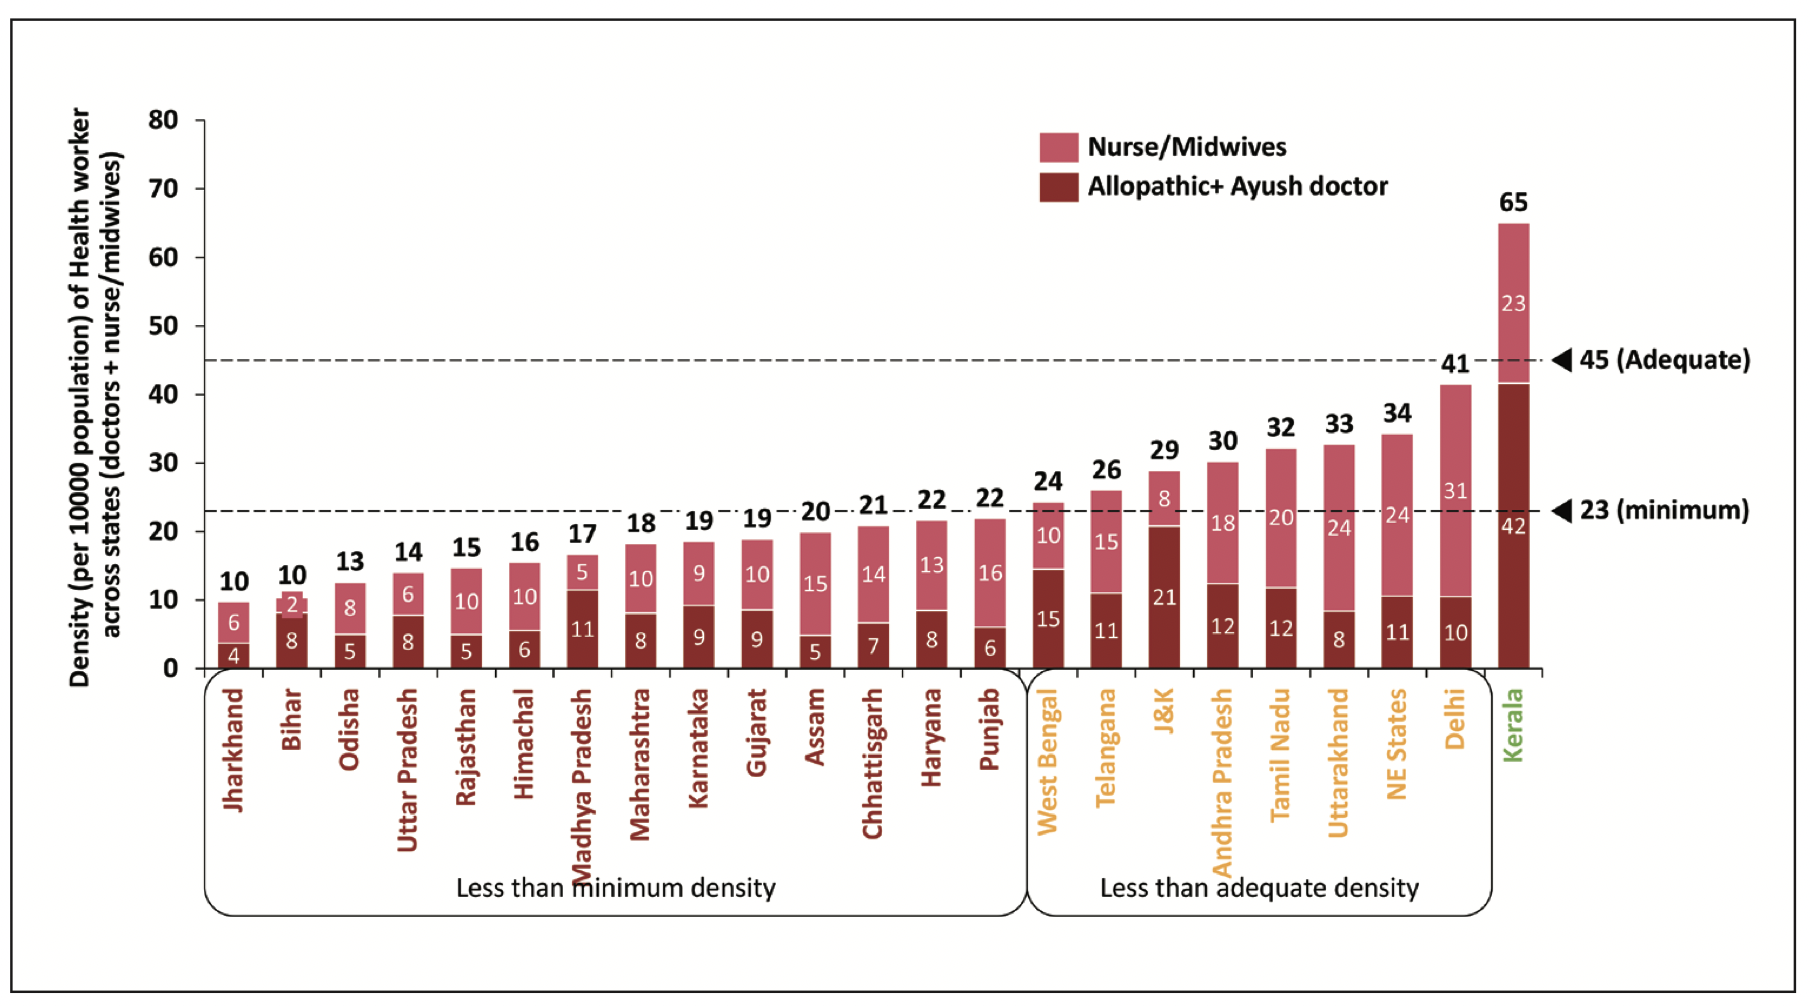
Apart from oxygen and hospital bed scarcity, experts like Dr. Devi Shetty have spoken about the scarcity of doctors and nurses to tackle the Covid challenge. WHO recommends aggregate density of health workers to be 44.5 per 10,000 population with a lower range of 23 to achieve 80 percent of births by skilled health professionals. Figure 8 [7] below shows the density of doctors and nurses/midwives in Indian states. In India, Kerala is the only state to meet the aggregate density of 45 while 8 other states meet the lower threshold of 23. Again, some of the poorest states like Jharkhand, Bihar, UP, Odisha have the lowest density of healthcare professionals.
Figure 8
Conclusion: Invest more in healthcare
While the non-allocation of more funds prevented longer term solutions, the failure to prepare for the second wave or to provide much higher resources for healthcare in pandemic year have only exacerbated the problem.
While building more hospitals or educating more doctors may not be possible in a short period, it was possible to plan for adequate medical oxygen supply to hospitals to prevent deaths, to build stocks of critical medicines for India’s large population or to create temporary structures to augment India’s health infrastructure in the short run. A report by India Today showed that instead of increasing oxygen-supported beds, ICU beds and ventilators, India saw a drastic decrease in their count between September 2020 and January 2021.
Moreover, poor investments have also hampered India’s Covid vaccination program with inadequate funding for advance purchase of vaccine stocks. As a result of this lapse, India’s vaccination program has slowed down and only made this crisis even worse.
The need to spend more on healthcare had been identified even in the National Health Policy 2017 but a commensurate increase in allocation has been missing. This failure to allocate more funds for healthcare even after identifying the need has created a dangerous situation for India as it stares at a health crisis and threatens to further increase the inequities across states.
[1] 4.1.2: Trends in Public Expenditure on Health, P172, National Health Profile 2019
[2] P152, Economic Survey 2020-21
[3] P152, Economic Survey 2020-21
[4] P156, Economic Survey 2020-21
[5] Government healthcare expenditure data from EPW Research Foundation and population projections from MoHFW.
[6] P45, National Health Accounts Estimates for India 2016-17
[7] P161, Economic Survey 2020-21
To cite this analysis: Ankur Bhardwaj (2021). “Healthcare Expenditure: A Festering Wound Ignored” Centre for Economic Data and Analysis (CEDA), Ashoka University. Published on ceda.ashoka.edu.in

If you wish to republish this article or use an extract or chart, please read CEDA’s republishing guidelines.
 Copied